Genome Sequencing
Novogene’s genome sequencing services help to meet a wide range of research goals. Our genome sequencing services encompass projects that require resequencing to compare samples against a reference genome as well as projects that require de novo sequencing to generate reference quality genomes of seldom-sequenced species.
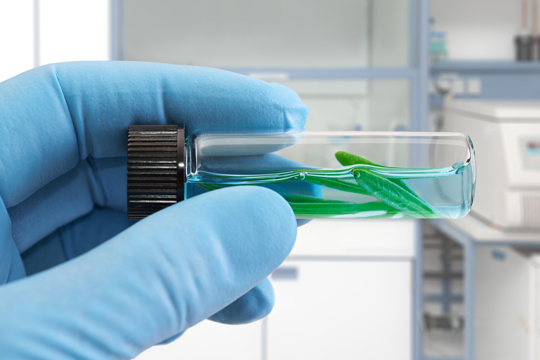
Human Whole Genome Sequencing / Animal and Plant Whole Genome Sequencing, focused on resequencing, can be utilized in a wide range of research studies including evolutionary biology, developmental biology, agriculture, microbiology, and biomedical research.
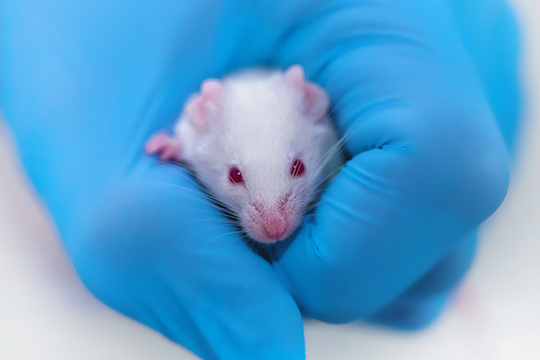
To efficiently conduct in-depth analysis of specific genomic regions, Novogene provide Human Whole Exome Sequencing and Mouse Whole Exome Sequencing to targeted analysis of exomes, the protein-coding regions of the genome.
Our Animal and Plant De novo Sequencing / Microbial De novo Sequencing service provides genome assembly and annotation for species, that have either never been sequenced before or species with missing or incomplete reference genomes.
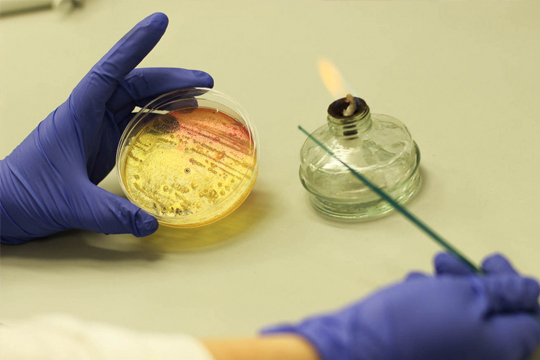
Metagenomics is the study of microbial communities in their original habitats, which can give a comprehensive insight into the interactions within these communities. Metagenomics can also help identify individual species within microbial habitats. Shotgun Metagenomic Sequencing refers to the approach of shearing DNA extracted from environmental samples and sequencing the small fragments to study not only the microbial species composition, but also the gene functions and metabolic pathways within them. 16S/18S/ITS Amplicon-based sequencing is a DNA sequencing method that focuses on sequencing specific target regions, amplicons, to understand the species composition and diversity within the community.


Technology
Sequencing Platform
-
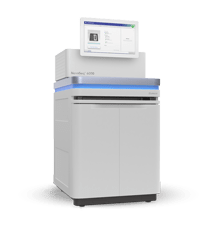
ILLUMINA
NovaSeq 6000
System specifications:80Gb - 6Tb output range, 1.6 - 40 B paired end reads per run, and PE150, PE250, PE50, etc.
-
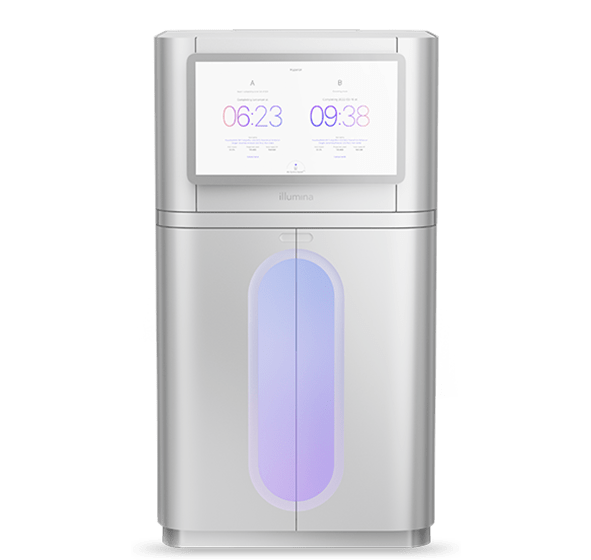
ILLUMINA
NovaSeq X Plus
System specifications:165Gb - 16Tb output range, 3.2 - 52 B paired end reads per run, and PE50, PE100, PE150, etc.c
-
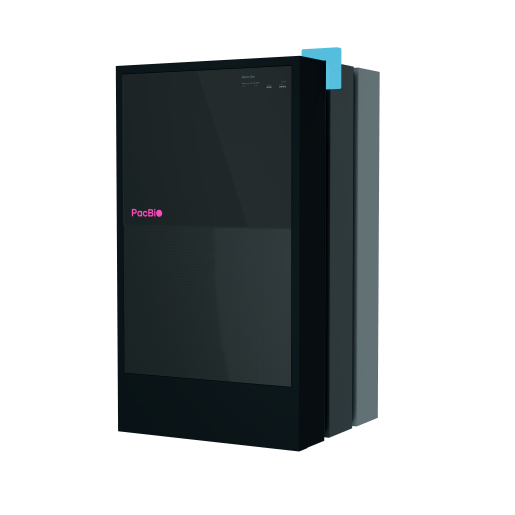
PACBIO
PacBio Revio System
System specifications:N50>15kb, 90% of bases ≥Q30, 90Gb HiFi yield / SMRT Cell, 360Gb HiFi yield / run, 24-hour run times etc.
-
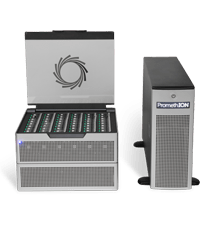
Nanopore
Nanopore PromethION
System specifications:Ultra-long reads up to 2Mb, high yields for large genomes, REAL real-time and accessible for flexible budgets.