Introduction to Isoform Sequencing

Isoform Sequencing (Iso-seq) using PacBio SMRT (Single Molecule, Real-Time) technology enables sequencing of full-length transcript isoforms (from 5’UTR to 3’poly-A tail) within the targeted genes. Iso-seq is a high-throughput method for characterizing fusion genes, identifying alternative splicing, annotating genomes, and discovering novel transcripts.
Iso-seq can be fully leveraged for medical and agricultural research purposes, including disease mechanism investigation, exploring drug resistance mechanisms, discovering new genes, as well as studying plant development and biotic and abiotic stresses.
Applications of Isoform Sequencing
- For investigating disease mechanisms
- For discovering alternatively spliced transcripts as potential biomarkers
- For exploring drug resistance mechanisms
- For identifying new genes and transcripts
- For improving genome annotations to recognize the coding regions, regulatory elements, and structural elements of the genes
- For understanding plant development under environmental stress
- For discovering new isoforms resulting from alternative splicing

Benefits of Isoform Sequencing
- Increased throughput on PacBio Revio platform with Kinnex full-Length RNA Kit
- Leading sequencing capacity, high-quality data, fast turnaround, and affordable prices.
- Well-developed pipeline to discover novel transcripts and perform differential expression and functional annotation analyses.
- Ability to optimize the sequencing process to surpass PacBio’s standards in read length and output.
Iso-seq Specifications: RNA Sample Requirements
| Library Type | Sample Type | Amount | Concentration | RIN (Agilent 2100) |
Purity (Nanodrop TM/Agarose Gel) |
| PacBio Kinnex Iso-Seq (PolyA enrichment) | Total RNA | ≥ 600 ng | ≥ 40 ng/μL | ≥ 6.5 | A260/280= 1.8-2.2; A260/230= 1.3-2.5; *NC/QC≤2; No genomic contamination |
*NC/QC: NanoDrop concentration/Qubit concentration.
Iso-seq Specifications: Sequencing and Analysis
| Platform | PacBio Sequel IIe and Revio platforms |
| Content of Analysis |
Isoform Characterization Structural Category Length Distribution Transcriptome Diversity
Transcription Factor analysis lncRNA prediction* Fusion Transcript analysis* Alternative Splicing analysis* Alternative PolyAdenylation analysis*
Gene expression analysis Differential gene expression analysis GO enrichment KEGG enrichment
|
*Only available when reference genome is available.
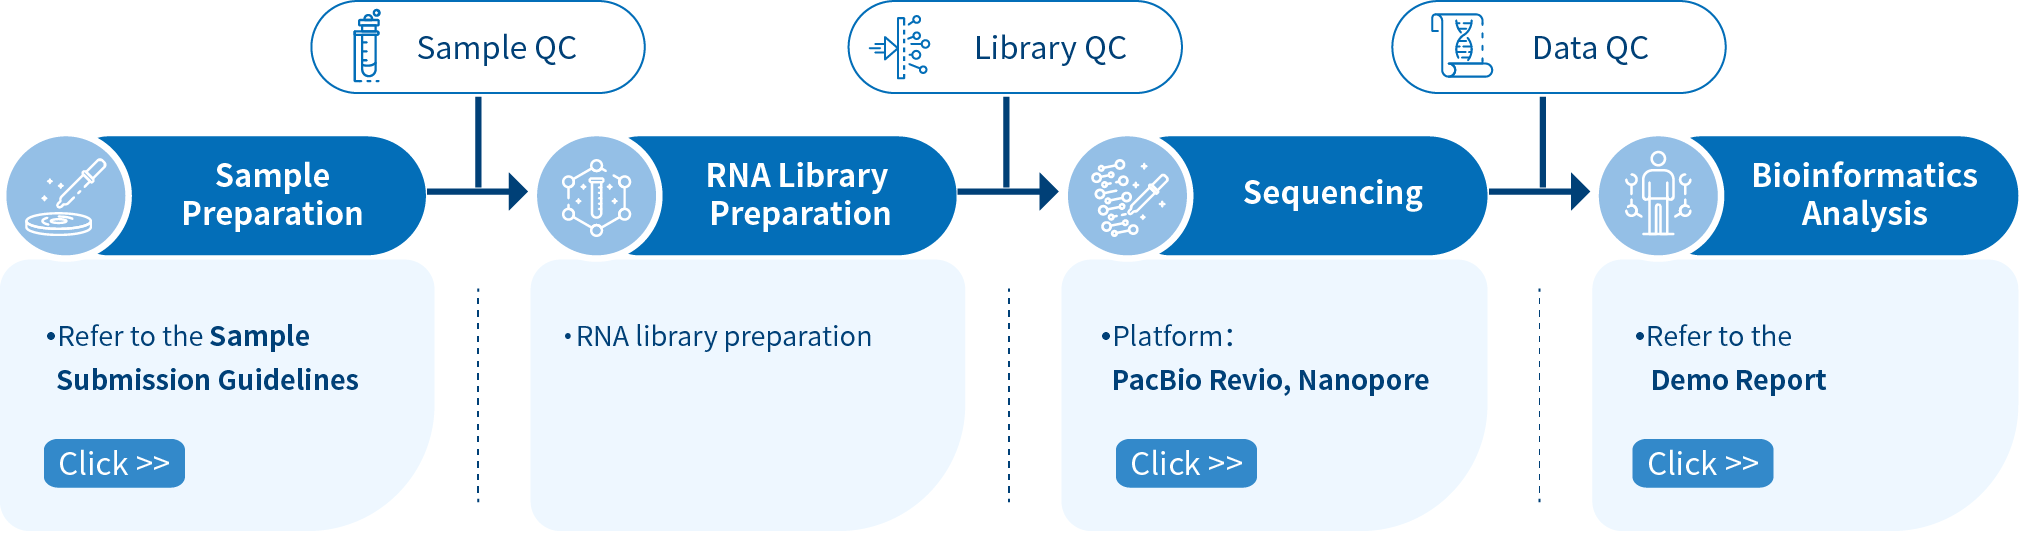
Novogene Workflow of Iso-seq Service
From sample and library preparation, SMRT sequencing, and data quality control, to bioinformatics analysis, Novogene provides high-quality products and professional services. Each step is performed in agreement with a high scientific standard and meticulous design to ensure high-quality research results.
Featured Publications of Isoform Sequencing
-
Large haploblocks underlie rapid adaptation in the invasive weed Ambrosia artemisiifolia
Nature Communications Data: March 2023IF: 16.6DOI: 10.1038/s41467-023-37303-4
-
Plant Biotechnology Journal Date: December 2023IF: 13.8DOI: 10.1111/pbi.14157
-
Scientific Data Date: January 2019IF: 5.929DOI: https://www.nature.com/articles/s41597-019-0240-1
Demo Results of Bioinformatics Analysis
CCS
The CCS (Circular Consensus Sequence), of each read can be created by correcting and aligning subreads to each other taken from a single ZMW(zero-mode waveguide).
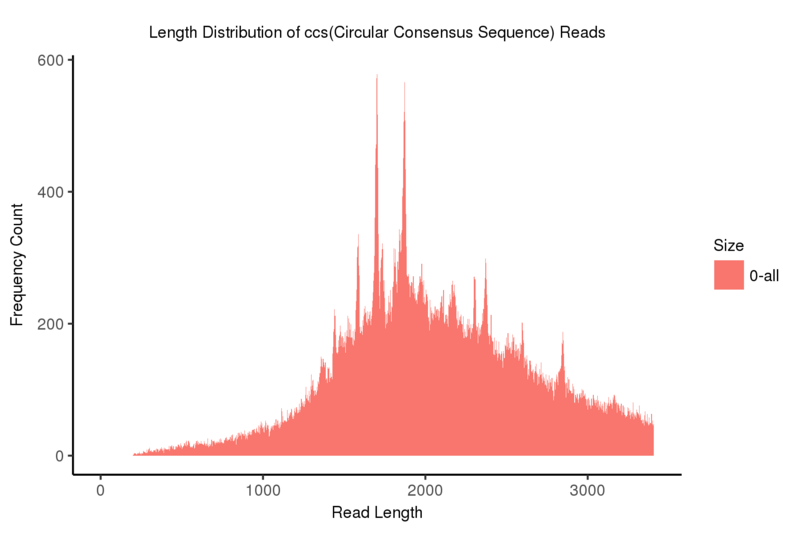
Length distribution of CCS(Circular Consensus Sequence) reads
Note:
The x-axis represents the read length; the y-axis indicates frequency count corresponding to the read length
Structural Category
Distribution of isoform numbers by the characterization results. There are a significant number of isoforms for NIC or NNC (Novel isoforms) (left); Usually, one-gene-one-isoform distribution can be observed in most of the cases, especially for Novel genes (right).
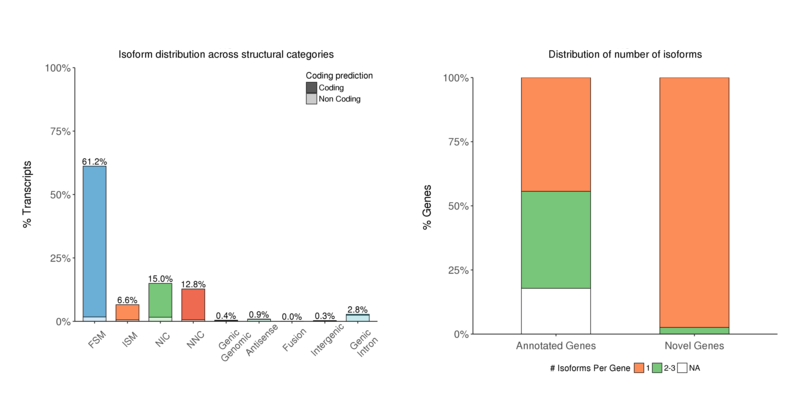
Isoform numbers by structural category (left) and by genetype (right)
Note:
The x-axis shows isoform classification; the y-axis shows isoform percentage for each classification (left);
The x-axis shows gene type; the y-axis shows genes percentage for each “isoforms per gene” classification (right)
Length Distribution
The transcript length distribution and exon number distribution of the isoforms by the structural classification are both presented in a boxplot.
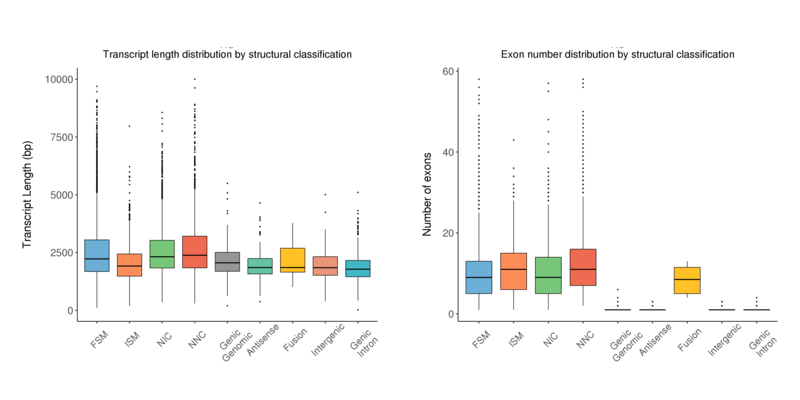
Transcript length distribution by structural classification (left) and exon numbers distribution by structural classification (right) by transcript type
Note:
The x-axis shows transcript classification; the left y-axis shows the length of transcript in each classification; the right y-axis shows the number of exons of transcript in each classification
Structure and Function annotation
Gene Ontology
The Gene Ontology (GO) project aims to provide reliable descriptions of gene products within several databases. GO vocabularies (ontologies) explain gene products concerning their associated biological processes, molecular functions, and cellular components in a species-independent approach. GO annotation is only available for identified novel genes and isoforms.
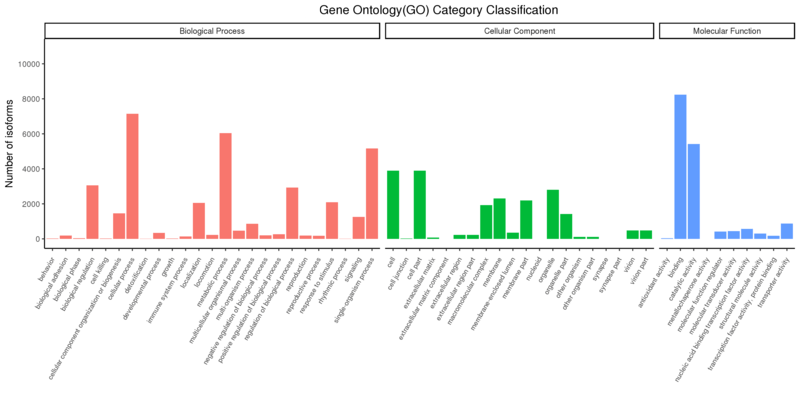
Gene Ontology Annotation Classification
Note:
The x-axis shows the three GO categories, and the y-axis shows the number of differential genes annotated to the term (including the sub-term of the term). The three different categories represent the three basic classifications of GO term (from left to right are biological processes, cellular components, and molecular functions);
Structure analysis
CNCI (Coding-Non-Coding Index) is a powerful signature tool to predict the sequences based on the intrinsic composition and offers accurate classification of transcripts assembled from whole-transcriptome sequencing data. PLEK(predictor of long non-coding RNAs and messenger RNAs based on an improved k-mer scheme) is a tool for predicting long non-coding RNAs and mRNAs in the absence of genomic sequences or annotations using a computational pipeline based on an improved k-mer scheme and a support vector machine (SVM) algorithm. The results from PLEK and CNCI are shown in the Venn diagrams.
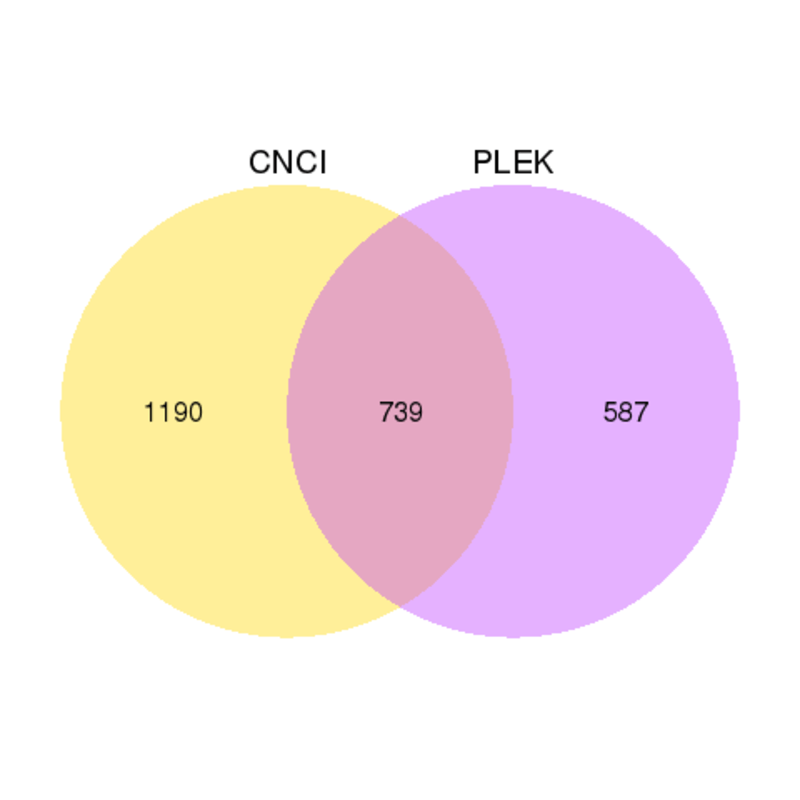
Venn diagrams of results from PLEK and CNCI
Alternative Splicing
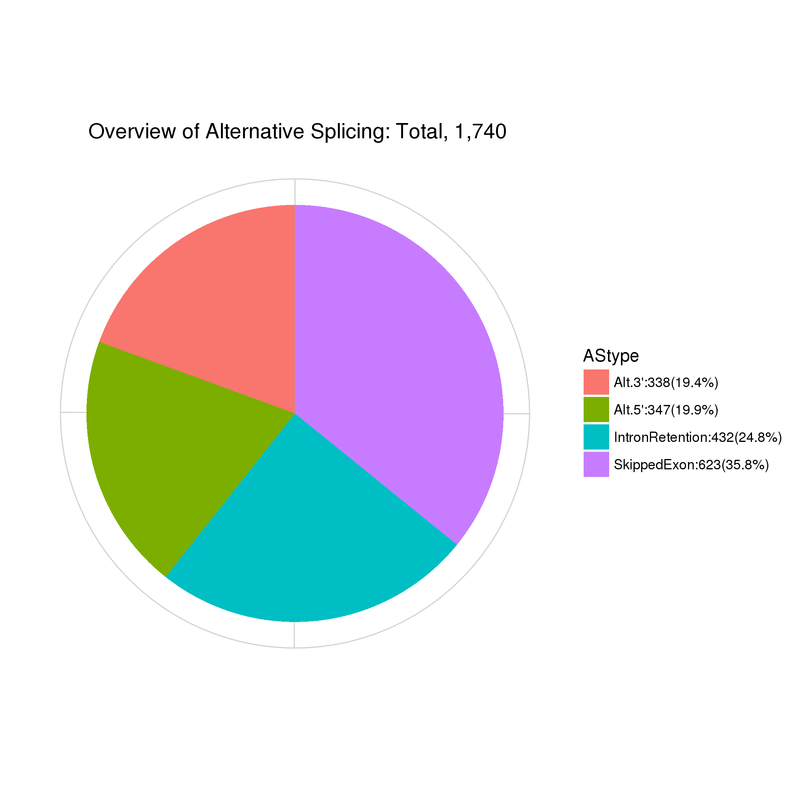
Summary of alternative splicing events
Note:
Alt.3’: Alternative 5′ splice site; Alt.5’:Alternative 3′ splice site
*Please contact us get the full demo report.