Introduction to Animal and Plant De novo Sequencing
De novo sequencing involves sequencing and assembling the genome of a species without relying on a reference genome, using PacBio long-read sequencing and Oxford Nanopore long-read sequencing to construct a complete genomic sequence map of the species. This approach not only provides a comprehensive genomic sequence map but also lays the foundation for further research into the species’ evolutionary origins and adaptations to specific environments.
To achieve the highest accuracy in genome assembly, Novogene leverages PacBio Revio and Oxford Nanopore PromethION platforms, delivering unparalleled contiguity for complex genomes. Our integrated approach combines Hi-C sequencing for chromosome-scale scaffolding, mRNA sequencing and full-length isoform sequencing for genome annotation. This multi-platform strategy enables us to deliver well-annotated, chromosome-level genomes.
Applications of Animal and Plant De novo Sequencing
For individual research:
- Guides animal health and genetic breeding
- Provides a theoretical basis for drug screening
- Explores medicinal resources and innovates varieties
For population research:
- Explores species origin and evolution
- Provides new insights into patterns of genome divergence
Benefits of Animal and Plant De novo Sequencing
- Highly experienced: Novogene’s highly qualified researchers have completed major De novo genome sequencing projects and managed to publish their data in top-tier journals.
- Bioinformatics expertise: Best-in-class and widely recognized software, such as Falcon and Canu, are being used for comprehensive plant and animal bioinformatic analyses.
- Diverse strategies: By incorporating sequencing results from various platforms including Illumina Novaseq, PacBio PacBio Revio/Sequel IIe, and Oxford PromethION, we offer the best assembly solution specifically tailored for each unique genome.
- Unsurpassed data quality: We guarantee a Q30 score ≥ 85%, exceeding Illumina’s official guarantee of ≥ 75%.

Animal and Plant De novo Seq Specifications:
DNA Sample Requirements
| Platform Type | Sample Type | Amount (Qubit®) | Purity |
|
Illumina NovaSeq X Plus / NovaSeq 6000 |
Genomic DNA |
≥ 200 ng |
OD260/280=1.8-2.0; no degradation, |
|
Genomic DNA (PCR free non-350bp) |
≥ 3 μg |
||
|
Genomic DNA (PCR free 350bp) |
≥ 1.1 μg |
||
| PacBio Revio DNA HiFi library | HMW Genomic DNA | ≥ 3 μg | A260/280=1.75-2.0; A260/230=1.5-2.6; *NC/QC=1.0-2.2 Fragments should be ≥ 30 kb |
| PacBio PCR product library |
PCR product | ≥ 2 μg | OD260/280=1.75~2.0; OD260/230=1.4~2.6; *NC/QC=0.95~3.00; Single band (PacBio library fragments distributed above 1k) |
| Nanopore PromethION DNA library |
HMW Genomic DNA | ≥ 8 μg | A260/280=1.75-2.0; A260/230=1.4-2.6; *NC/QC=0.95~3.00 Fragments should be ≥ 30 kb |
| Nanopore Ultra-long DNA Library | uHMW Genomic DNA (plant and animal tissues) | ≥ 20 μg | OD260/280=1.7-2.0; OD260/230=1.3-2.6; *NC/QC=0.95-3.00; Fragments should be ≥ 100k, no fragments below 30k. |
| Nanopore PCR product library |
PCR product | ≥ 2 μg | OD260/280=1.75~2.0; OD260/230=1.4~2.6; *NC/QC=0.95~3.00; Single band |
NC/QC:NanoDrop concetration/Qubit concentration
Animal and Plant De novo Seq Specifications:
Sequencing and Analysis
| Sequencing Type | Short-read Sequencing | PacBio Revio | Nanopore PromethION |
| Read Length | Paired-end 150 bp | N50>15 kb, long read lengths up to 25 kb | Ultra-long reads N50 > 50 kb or 100 kb |
| Recommended Sequencing Depth |
For genome survey or assembly polishing: ≥ 50× RNA requires 4 to 6 different tissue sites. |
For genome assembly: ≥ 30× | |
| Standard Analysis |
K-mer analysis GC content analysis Repeat content rate evaluation Heterozygous rate evaluation Genome size evaluation |
Long-read assembly Assembly statistics Gene completeness evaluation |
|
| Genome Annotation | - |
Repeat prediction Structure prediction Function prediction Noncoding RNA prediction |
|
| Advanced Analysis | – |
Comparative genomics Pan-genome analysis Telomere-to-telomere genome assembly Perfect telomere-to-telomere genome assembly |
|
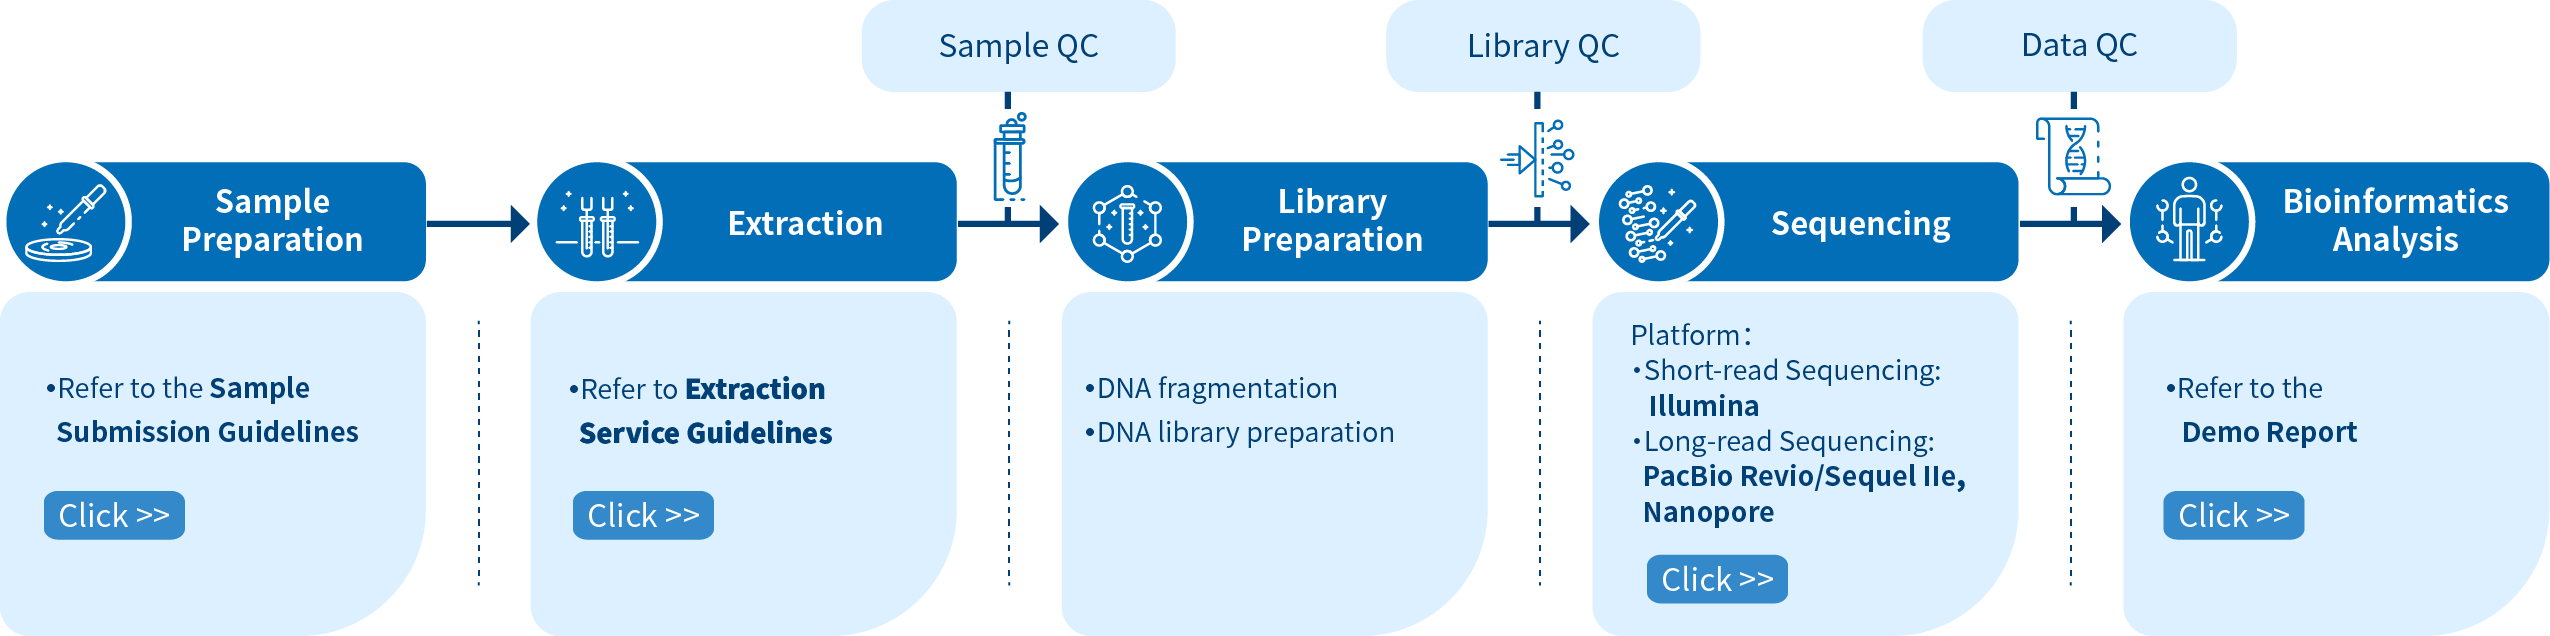
Novogene Workflow of Animal and Plant De novo Service
From sample preparation library preparation, short and long-read sequencing, and data quality control, to bioinformatics analysis, Novogene provides high-quality products and professional services. Each step is performed in agreement with a high scientific standard and meticulous design to ensure high-quality research results.
Featured Publications of Animal and Plant De novo Sequencing
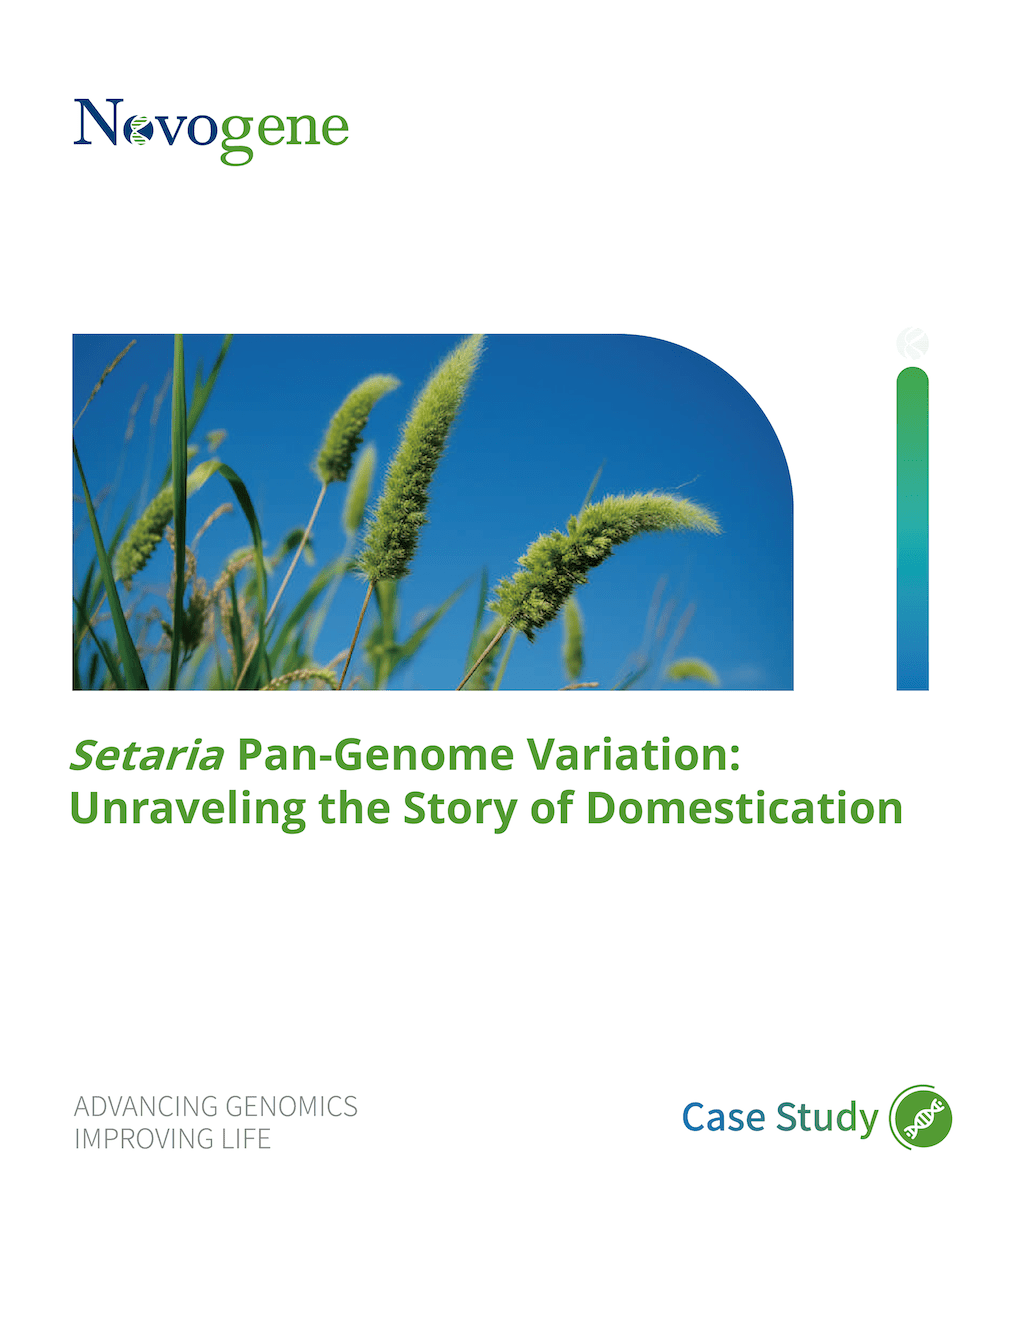
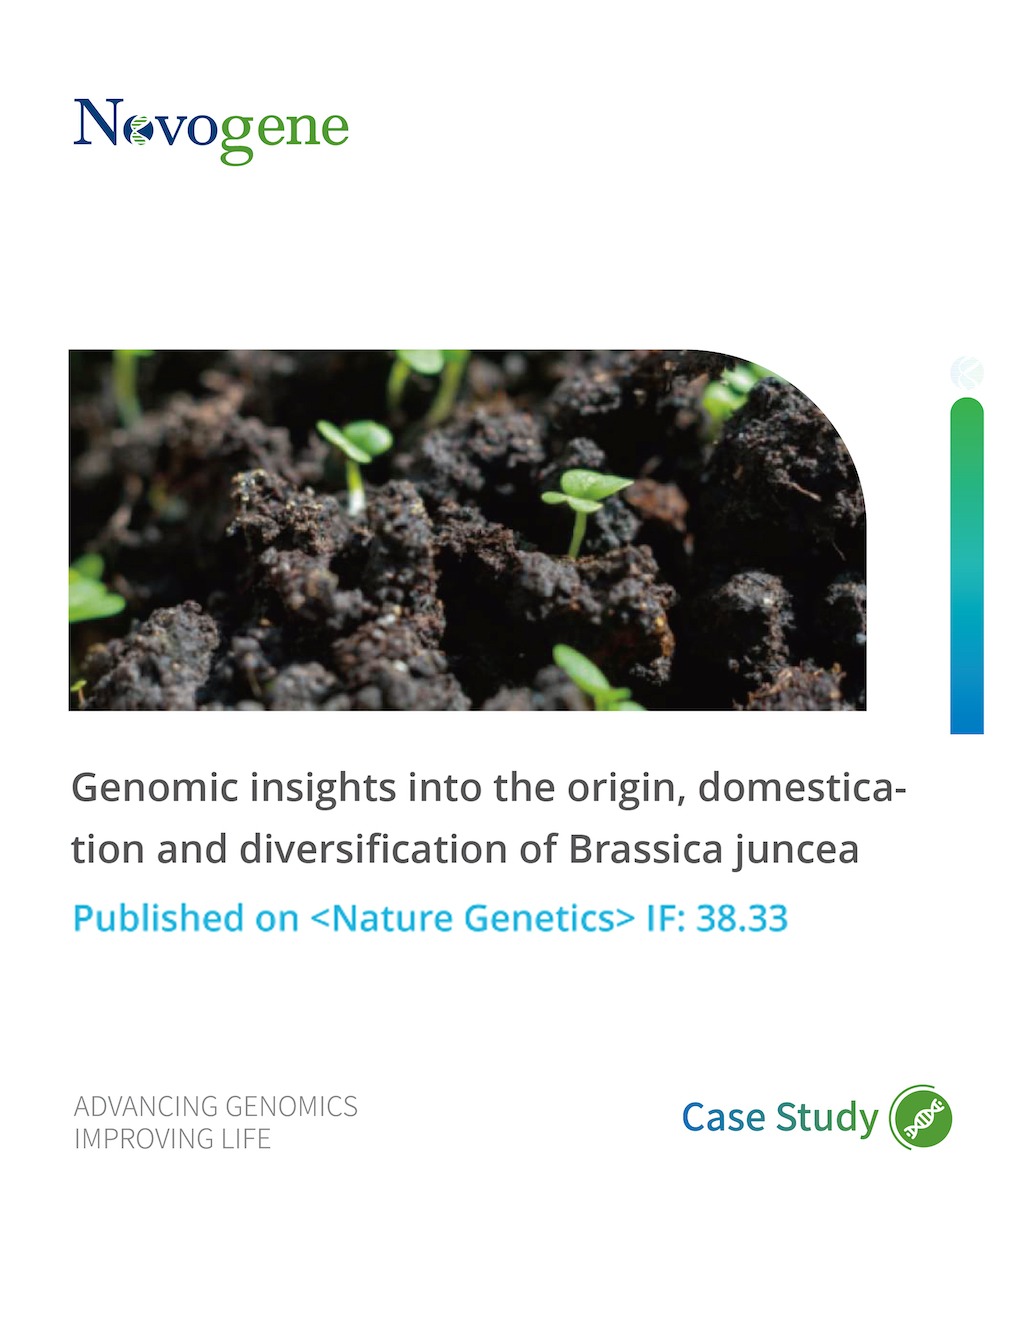
Case Studies
-
Horticulture Research Date: November 2023IF: 8.7DOI: 10.1093/hr/uhad201
-
Pangenomic analysis identifies structural variation associated with heat tolerance in pearl millet
Nature Genetics Date: March 2023IF: 30.8DOI: 10.1038/s41588-023-01302-4
-
Plant Biotechnology Journal Date: April 2023IF: 13.8DOI: 10.1111/pbi.14058
-
Science Advances Date: April 2020IF: 12.804DOI: https://www.science.org/doi/10.1126/sciadv.aay3240
-
Deciphering the High Quality Genome Sequence of Coriander that Causes Controversial Feeling
Plant Biotechnology JournalIssue Date:2019IF: 6.84DOI: https://onlinelibrary.wiley.com/doi/10.1111/pbi.13310
-
Chromosome-level genome assembly of the razor clam Sinonovacula constricta (Lamarck, 1818)
Molecular Ecology ResourcesIssue Date: July 2019IF: 7.049DOI: https://onlinelibrary.wiley.com/doi/10.1111/1755-0998.13086
-
Genome assembly provides insights into the genome evolution and flowering regulation of orchardgrass
Plant Biotechnology JournalIssue Date: 2019IF: 6.84DOI: https://onlinelibrary.wiley.com/doi/10.1111/pbi.13205
Long Read Sequencing
Assembly statistics
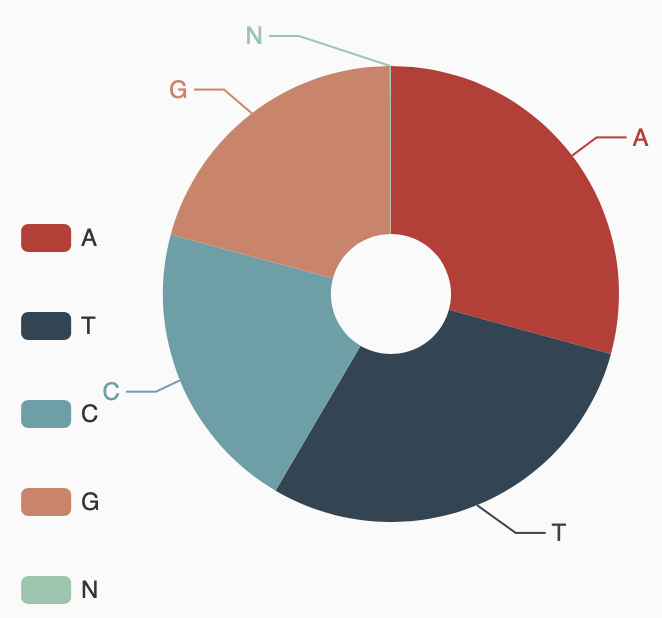
Grain Aphid genome A/T/G/C content statistics
Assembly evaluation-BUSCO assessment
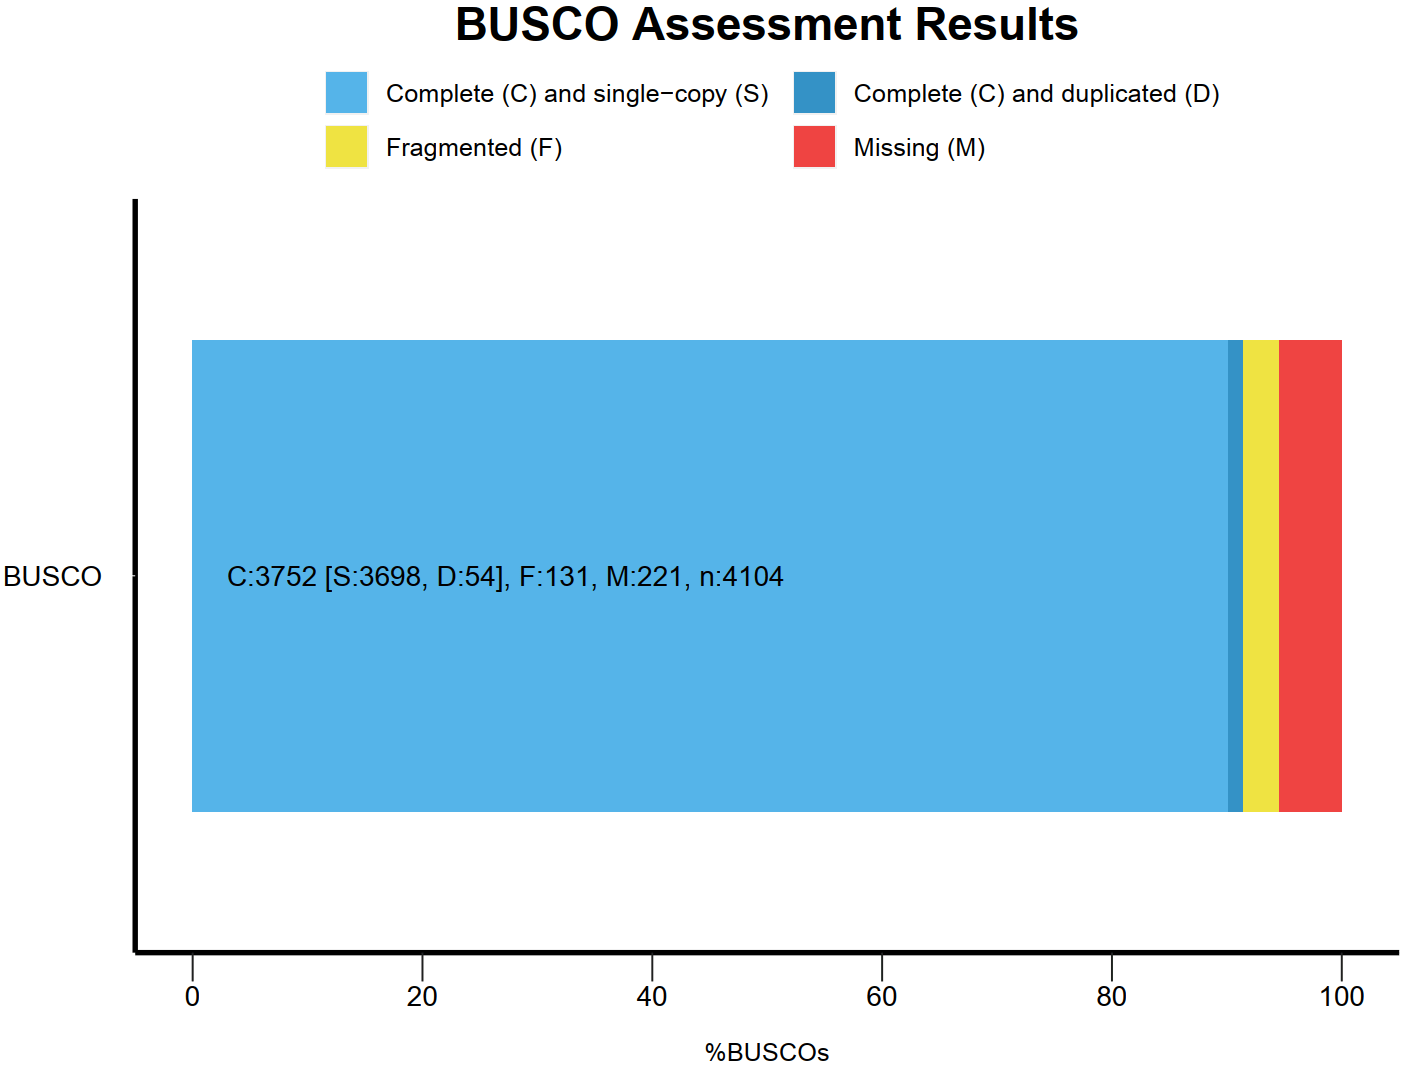
BUSCO assessment results
Note:C:Complete BUSCOs; S:Complete and single-copy BUSCOs; D:Complete Duplicated BUSCOs; F:Fragmented BUSCOs; M:Missing BUSCOs; n:Total BUSCO groups searched
Assembly evaluation- CEGMA assessment

Sequencing depth distribution
Note:
X-axis: sequencing depth/X; y-axis, proportion of bases in the genome
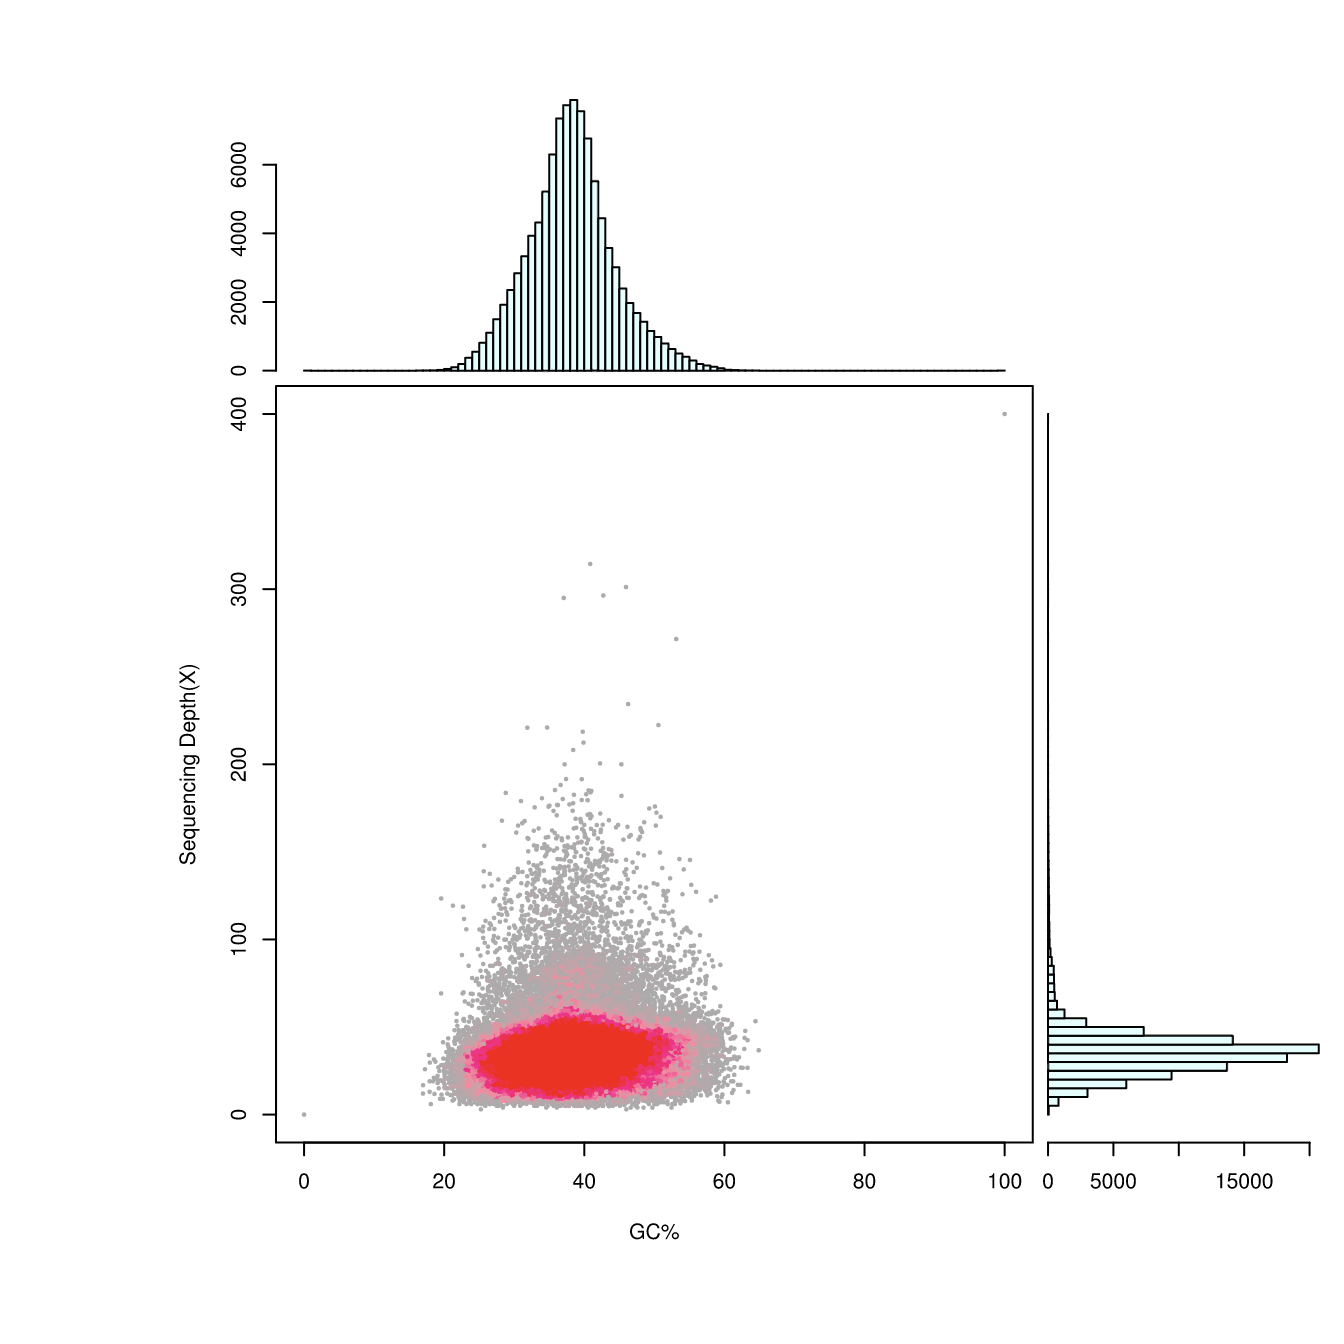
GC content and depth distribution
Note:
X-axis: GC contents; y-axis: sequencing depth.
Upper: GC content distribution. Lower right: sequencing depth distribution.
Genome Annotation
Structure prediction
Augustus, GlimmerHMM, SNAP, Geneid and Genscan are used in De novo gene structure prediction.
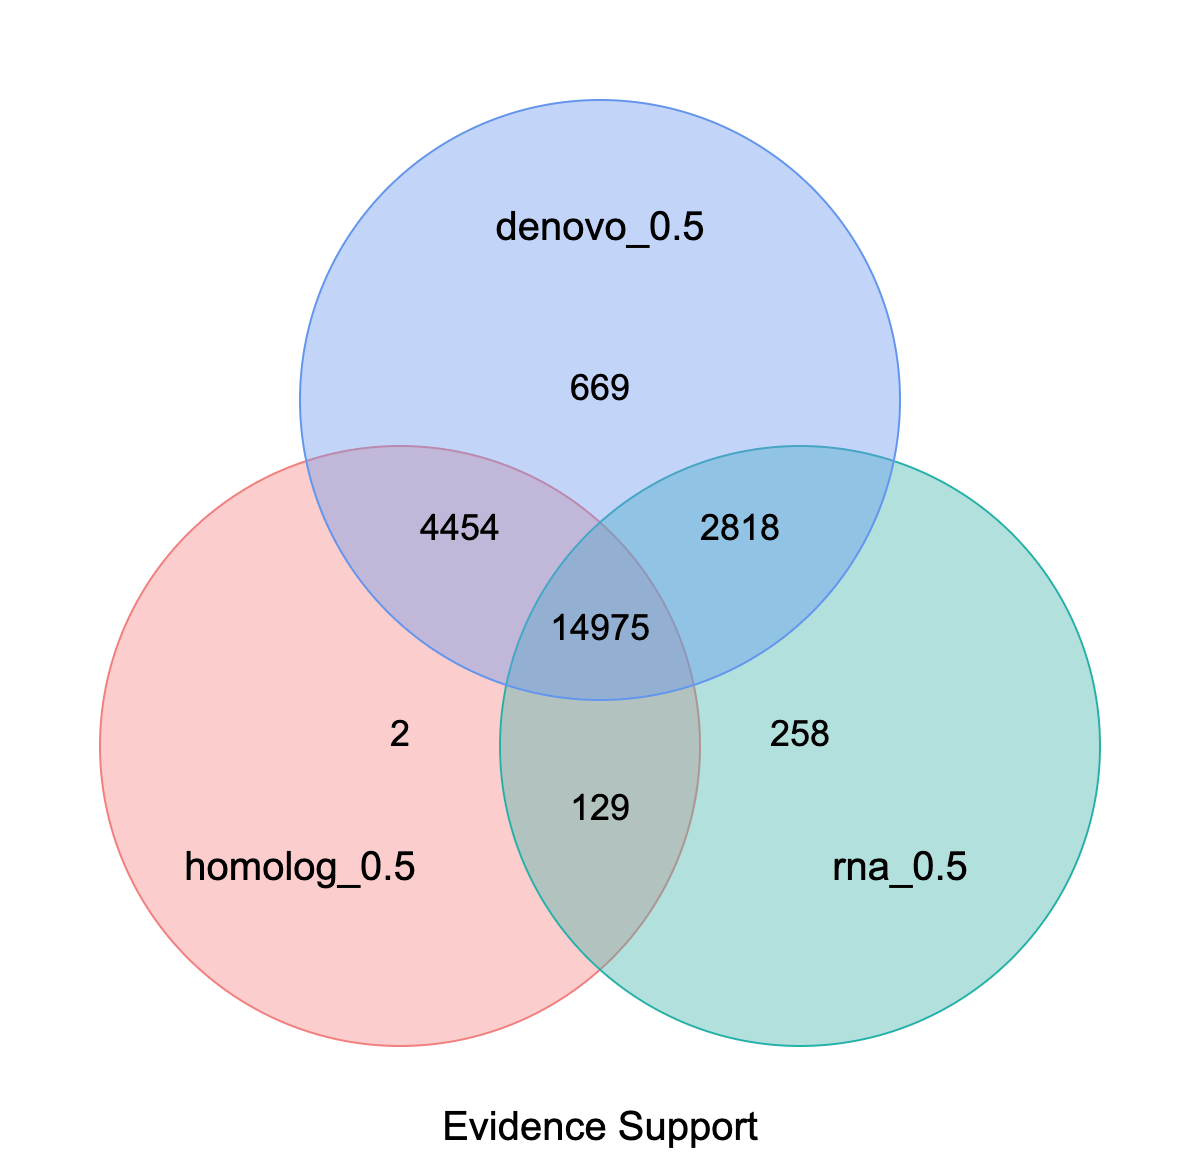
Venn diagram of gene set evidence support
Function prediction
Protein sequences predicted by gene structure are aligned with known protein databases. Results suggest that the function of 95.8% of the genes could be predicted.
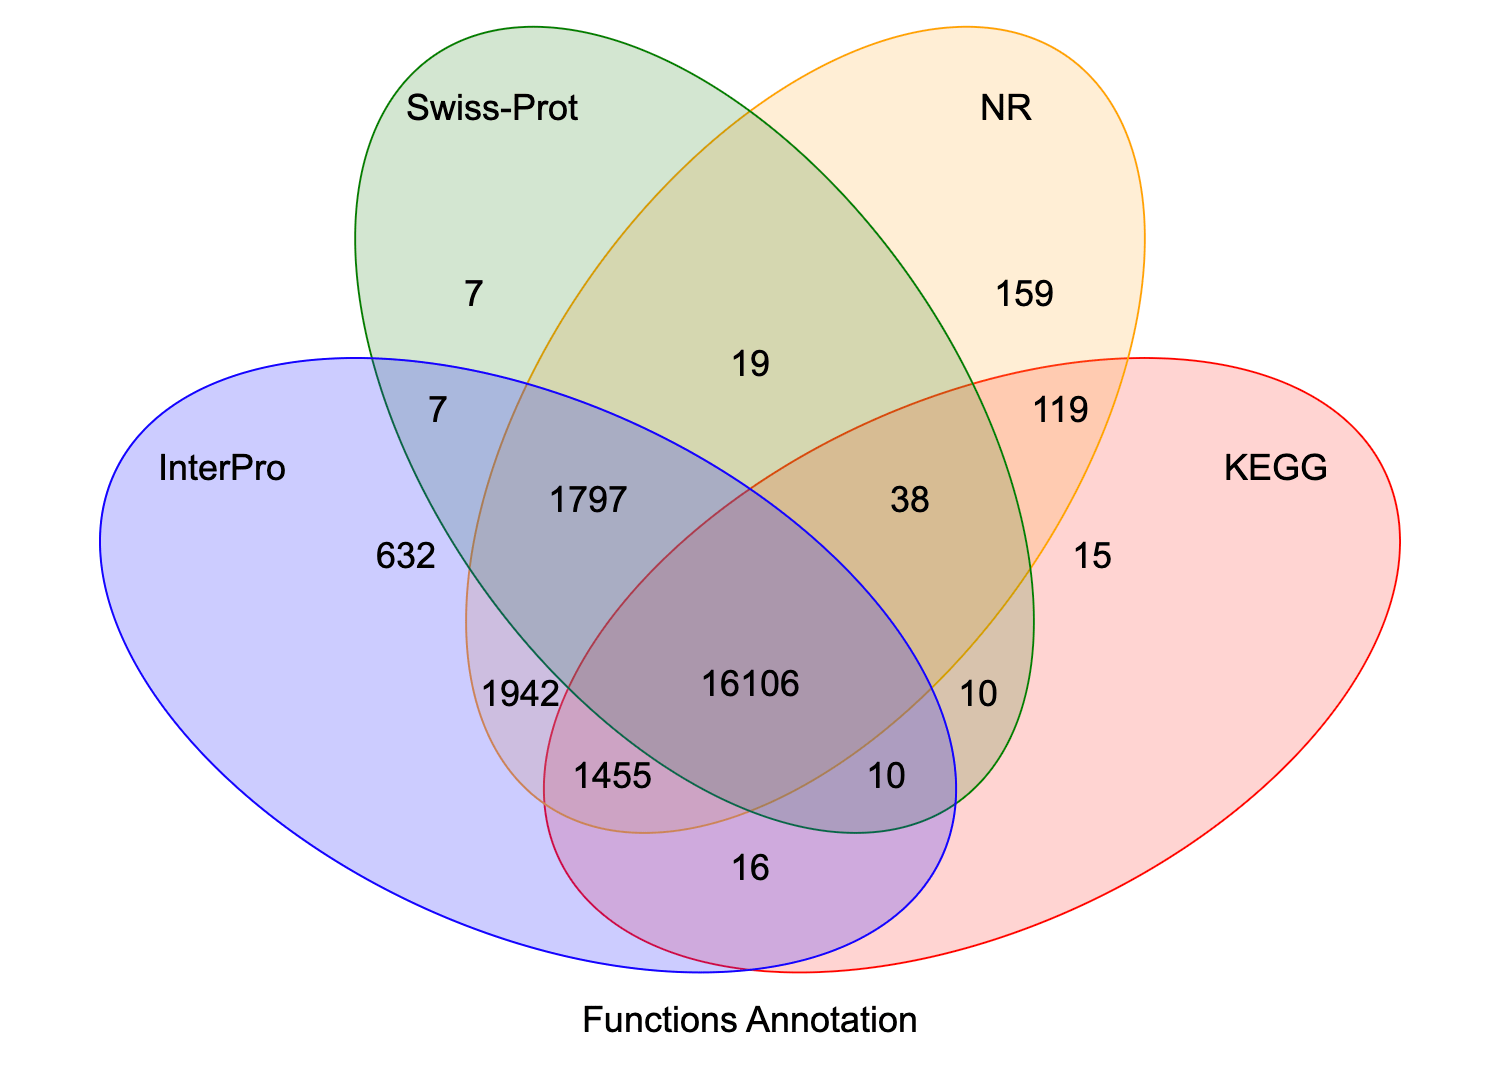
Venn diagram of gene function annotation
Short Read Sequencing
K-mer Analysis
Kmer=17analyses and genome size evaluation
| Kmer | Depth | n_kmer | Genome_size(M) | Revised Genome_size(M) | Heterozygous_rate(%) | Repeat_rate(%) |
| 17 | 67 | 203,660,880,738 | 3,039.71 | 3,020.12 | 0.46 | 60.41 |
Note:
(1)K-mer:Selected K-mer length.
(2)Depth:The expected value of K-mer depth.
(3)n_K-mer:The total number of K-mer from SOAPdenovo.
(4)Genome size(M):The genome size in Mb estimated by formula: Genome Size=K-mer_num/Peak_depth.
(5)Revise Genome size(M):Revised genome size after error correction from wrong K-mer.
(6)Heteozygous ratio:The percent of heteozygous positions.
(7)Repeat:Calculated by the percentage of K-mer numbers after 1.8-fold of the main peak of total K-mer numbers.
Note: The repeat here is a mathematically repeated sequence but not a repeat element with certain biological functions.
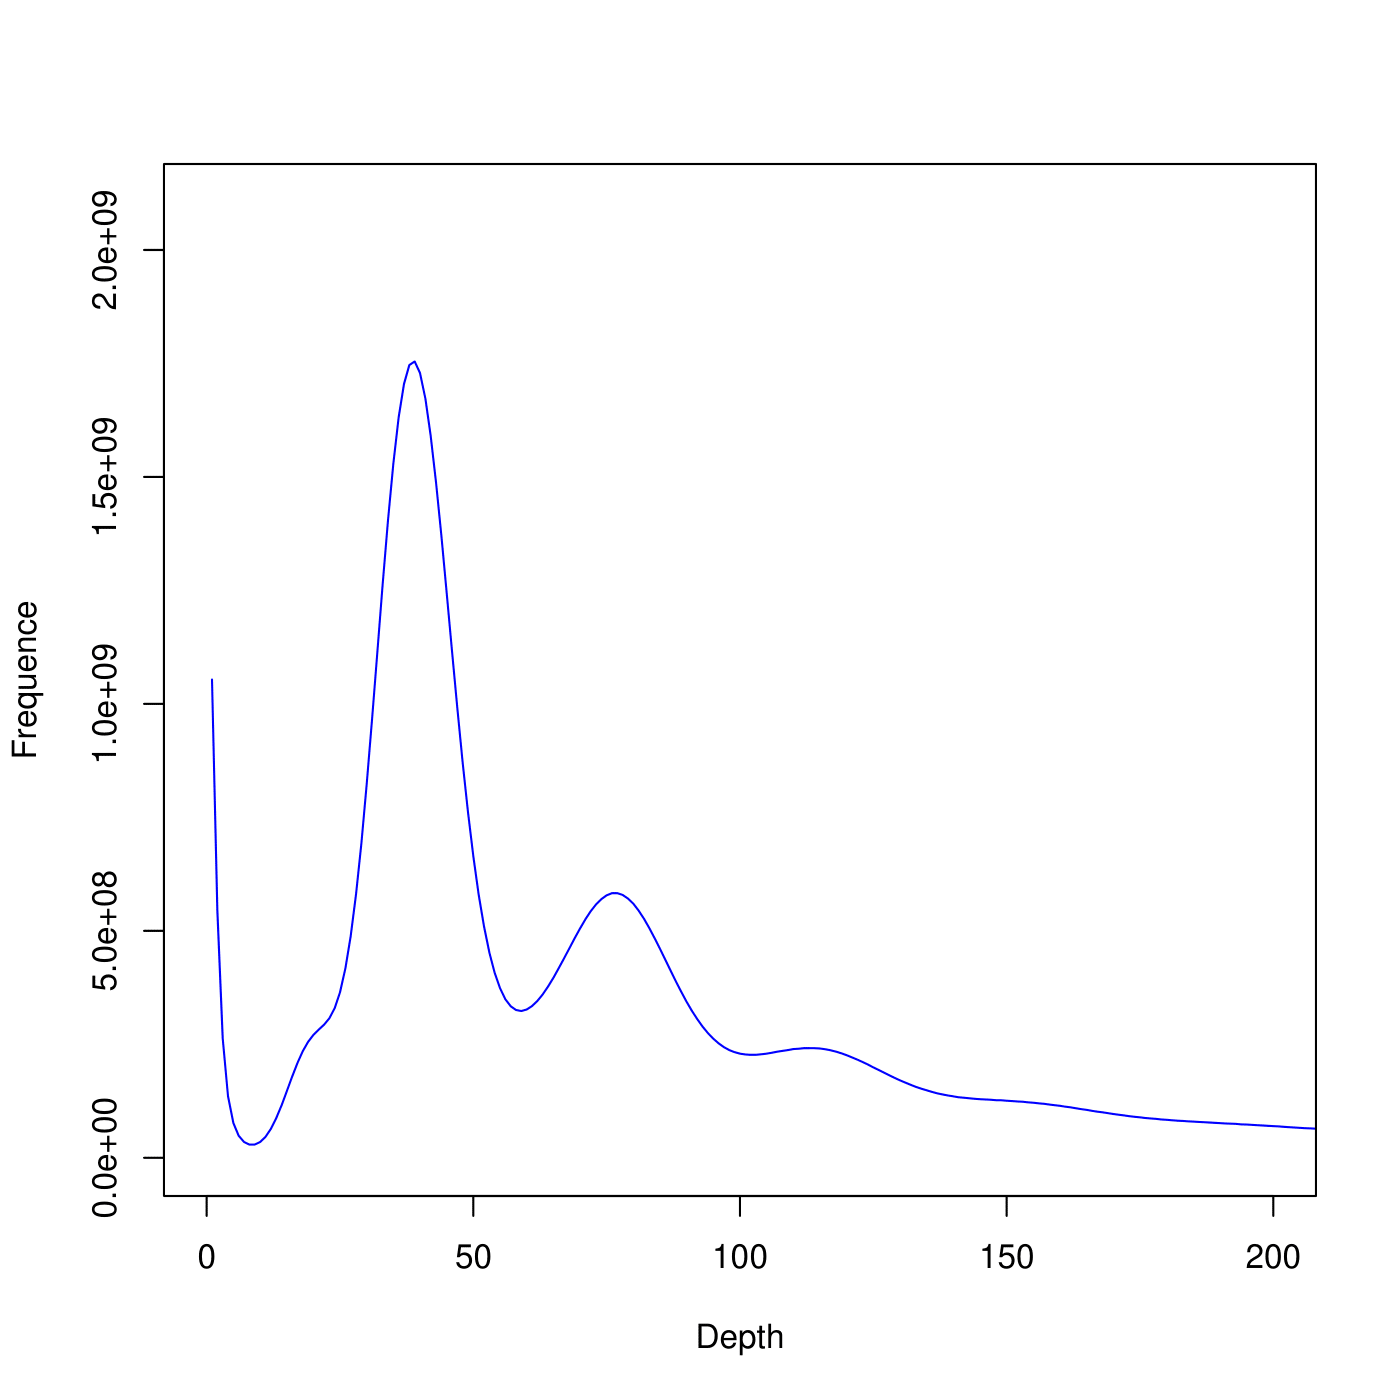
Distribution of K-mer number/type frequency and depth
Note:
X-coordinate is K-mer depth. Y-coordinate is the frequency of each K-mer depth.
*Please contact us to get the full demo report.