Introduction to Metatranscriptome Sequencing

Metatranscriptomics refers to the study of the function of an entire set of transcripts by RNA-sequencing from environmental samples at a specific time. It tells us about the genes that are highly expressed in a particular microbial environment.
Metatranscriptome sequencing delivers the whole expression profile by randomly sequencing mRNAs and tracks the dynamics of gene expression patterns in microbial communities over time using next-generation sequencing (NGS). This improves our understanding of the structure, function, and adaptive mechanisms of complex communities.
Applications of Metatranscriptome Sequencing
- Metatranscriptome sequencing assists in the characterization of functionally active bacteria and community metabolic interaction in microbial ecology research
- Metatranscriptome sequencing contributes towards clinical research by recognizing immune response and triggering autoimmune processes
- Metatranscriptome sequencing provides new opportunities for discovering innovative resources for drug delivery that are not easily accessible today owing to the technical limitations in microbial isolation
- Metatranscriptomics techniques help improve the quality of food and provide data associated with the metabolic behaviors of microbial communities
Benefits of Metatranscriptome Sequencing
- In profiling transcriptome of a natural communities, without the isolation and cultivation of microbes.
- In identifying novel genes and detecting the changes in complex microbial communities at the transcriptional level.

Metatranscriptome Sequencing Specifications: RNA Sample Requirements
| Library Type | Sample Type | Amount | RNA Integrity Number (Agilent 2100) |
Purity (NanoDrop) |
| Meta-transcriptome Library | Total RNA | ≥ 1 μg | ≥ 5.8, with flat baseline | A260/280 ≥ 2.0;
A260/230 ≥ 2.0; |
Metatranscriptome Sequencing Specifications: Sequencing and Analysis
| Sequencing Platform | Illumina NovaSeq 6000 Sequencing System |
| Read length | Paired-end 150bp |
| Recommended Data Amount | ≥ 20 million read pairs per sample |
| Content of Data Analysis |
|
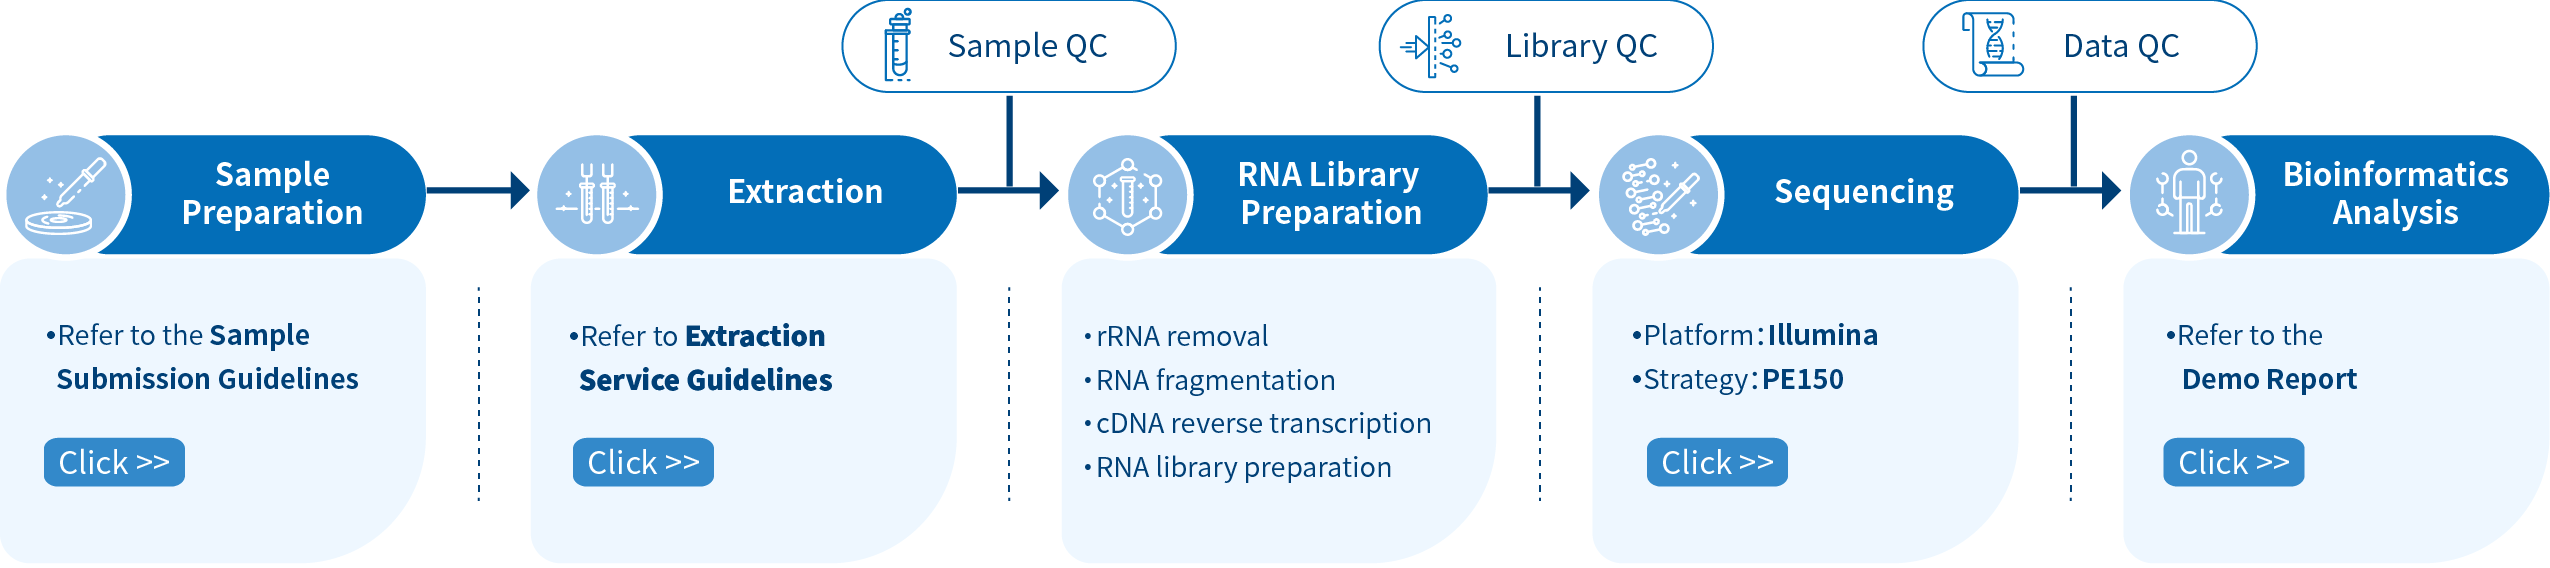
Novogene Workflow of Metatranscriptome Sequencing Service
The first step of the project workflow includes sample quality control (Sample QC) to ensure that your samples meet the criteria of the RNA-Seq technique. Then, the appropriate library is prepared according to your target organism and subsequently tested for its quality (Library QC). Next, a paired-end 150 bp sequencing strategy is used to sequence the samples and the resulting data go quality data control (Data QC) to guarantee the quality of the resulting data. Finally, bioinformatic analyses are performed and publication-ready results are provided. The following flowsheet describes the step-by-step protocol.
-
First report of Strawberry virus 1 infecting strawberry in China
Plant Disease Date: March 2021 IF: 3.809DOI: https://doi.org/10.1094/PDIS-01-21-0038-PDN
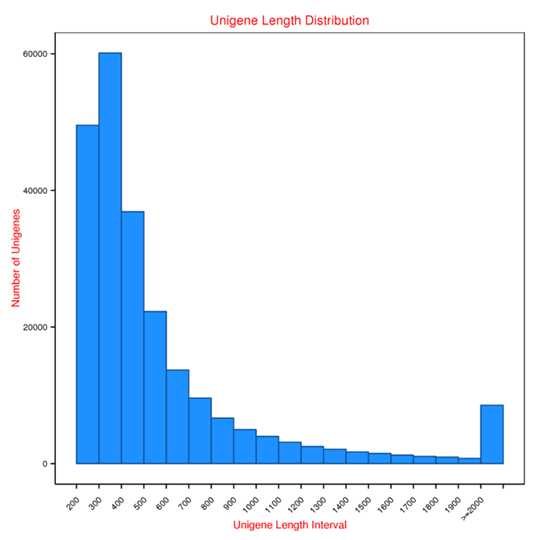
Length distribution of Unigenes
Unigene: the longest transcript of each cluster from Metatranscriptome assembly.
Note:
The figure shows the Unigenes length distribution and the number of Unigenes in different length intervals.
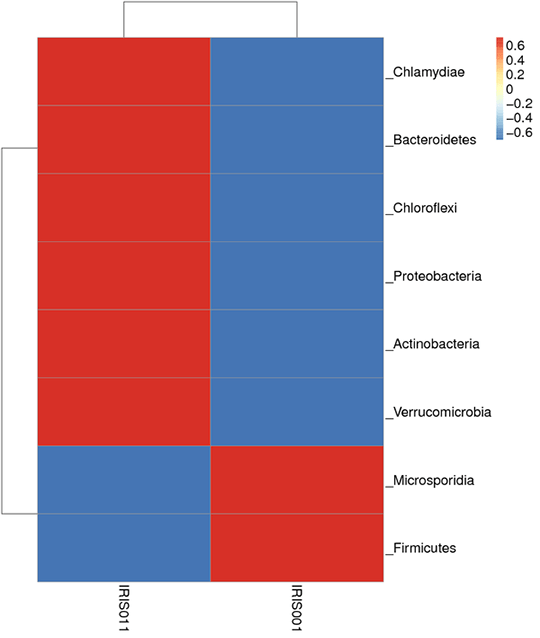
Species abundance clustering
From each sample, 35 dominant genera were selected based on the species annotation results and abundance information followed by clustering depending on the taxonomy information and the inter-sample differences among samples.
Note:
In this figure, the Bray-Curtis distance clustering tree structure is on the left side; the relative abundance distribution map of each sample at the phylum level is shown on the right side.
Comparison of gene expression levels under experimental conditions
The density distribution map and box plot were used to examine the distribution of gene expression in FPKM under different experimental conditions.
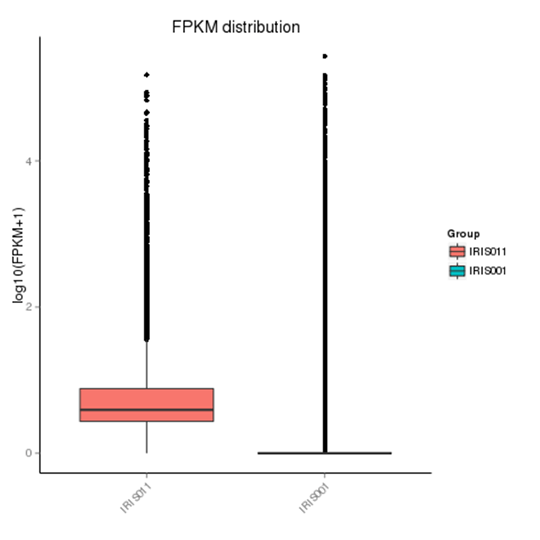
Note:
In the FPKM box plot, the x-axis shows the sample names, the y-axis is log10 (FPKM+1), and the box plot for each region has five statistics (from top to bottom are the maximum, the upper quartile, median, lower quartile, and minimum). The graph measures total expression and the differences between samples in terms of discreteness.
Volcano diagram of differentially expressed genes
Volcano plots are used to infer the overall distribution of differentially expressed genes.
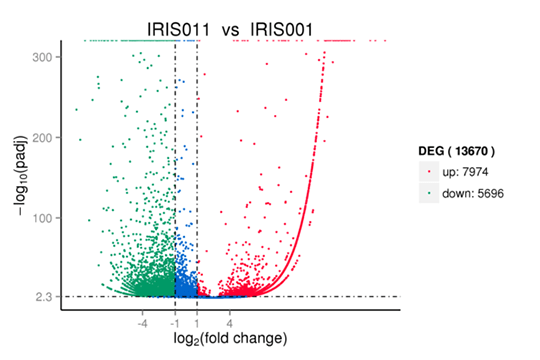
Note:
Red, and green show significantly up-, and down-regulated genes, respectively. Blue indicates no significance.
*Please contact us to get the full demo report.