Spatial transcriptomics combines next-generation sequencing with spatial information to uncover cellular heterogeneity and tissue architecture. Unlike bulk and single sequencing, it enables researchers to analyze gene expression within intact tissue structures, providing spatially resolved insights into complex biological systems.
Novogene offers comprehensive, end-to-end spatial transcriptomics solutions-from sample processing and library preparation to sequencing and advanced bioinformatics analysis-powered by leading platforms including 10x Genomics and STOmics.
Why Choose Novogene for Spatial Transcriptomics?
PhD-Level Expert Team
Novogene is supported by a highly experienced team of PhD-level scientists specializing in both experimental workflows and bioinformatics analysis. Our experts bring over 20 years of combined experience in clinical pathology and tissue-based research, ensuring optimal handling of complex samples and accurate interpretation of spatial transcriptomics data. As a certified partner of 10x Genomics and STOmics Stereo-seq, we deliver trusted, industry-leading solutions.
Advanced Technology Platforms
We provide access to cutting-edge spatial transcriptomics platforms, including 10x Genomics Visium HD, Visium HD 3’, and STOmics Stereo-seq. Our laboratory is equipped with state-of-the-art instruments such as the Leica CM3050S cryostat and Aperio Versa 8 fluorescence microscope, enabling high-quality tissue preparation, imaging, and spatial capture for reliable downstream analysis.
Proven Experience Across Diverse Projects
With over 4,000 completed spatial and transcriptomics-related projects, Novogene has extensive experience working with more than 50 species and 100+ tissue types. Our robust workflows have been validated across a wide range of research areas, including oncology, immunology, neuroscience, and translational medicine, ensuring consistent and reproducible results.
High-Impact Scientific Outcomes
Novogene has contributed to over 350 peer-reviewed publications in top-tier journals such as Nature, Cell, and other high-impact scientific publications, with a cumulative impact factor exceeding 4,800. Our data quality and analytical rigor support breakthrough discoveries and enable researchers to publish in leading journals.

Spatial Transcriptomics Platforms at Novogene
10x Genomics Visium HD
- High-resolution spatial gene expression profiling
- Compatible with FFPE, fresh frozen, and fixed frozen samples
- Improved gene detection sensitivity across spatial domains
10x Genomics Visium HD 3’
- Broad eukaryotic species support
- Optimized for poly-A transcript detection
- Ideal for scalable spatial transcriptomics across diverse species
STOmics Stereo-seq OMNI FFPE
- Ultra-high throughput spatial transcriptomics
- Suitable for large tissue sections
- Massive spatial capture area for whole-tissue profiling
Sample Requirements
| Service | Sample Input Type | ||
| FFPE Blocks | FFPE Slides | FF OCT Blocks | |
| 10x Visium HD | ✅ | ✅ | ✅ |
| 10x VIsium HD 3’ | ❌ | ❌ | ✅ |
| Stereo-Seq OMNI FFPE | ✅ | ✅ | ❌ |
| Sample Requirement | 1 block, placed in a plastic dehydration box | – RNA QC: 5-10 FFPE sections (10μm thickness), placed in a tube; – Library construction: 2-4 FFPE tissue sections (5μm thickness), placed on slides and stored in slide mailing boxes |
Tissue thickness >1mm, area <6.5×6.5mm |
| Storage Conditions | 4℃ storage after embedding, protected from light | Dry and sealed, 4℃ storage for no more than 30 days | -80℃ storage, mark the cutting surface on the embedding box |
| Shipping Conditions | 4℃ or room temperature | 4℃ or room temperature | Dry ice shipping |
Sequencing Specifications for Spatial Transcriptomics
| 10x Visium HD | 10x Visium HD 3’ | Stereo-Seq OMNI FFPE | |
| Species | Human & Mouse | Broad Eukaryotes* | |
| Resolution | 2um | 0.5-0.6um | |
| Sequencing Platform | Illumina NovaSeq XPlus | DNB-Seq | |
| Read Length | PE150 | PE75 | |
| Recommended Data Amount | 300M Read Pairs ~ 100Gb/sample | 210Gb/sample | 2.5B Reads/sample |
| Bioinformatics Analysis |
|
||
*Broad Eukaryotes: any species with poly-A tail
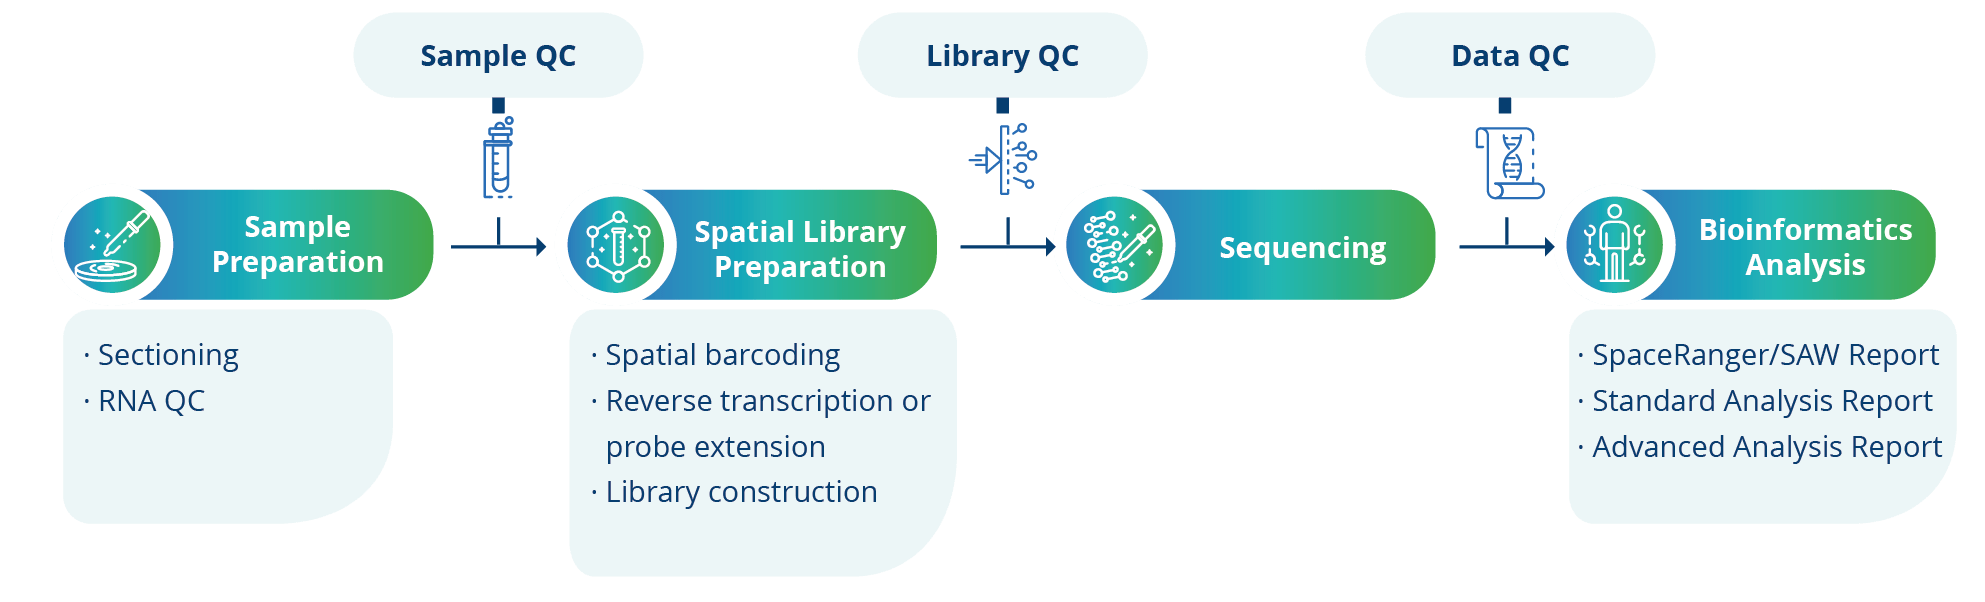
Project Workflow
Demo Results of Bioinformatics Analysis
Contact us for a demo report.
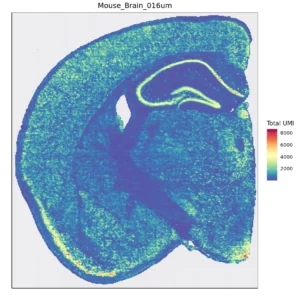
Figure 1. Spatial quantification of gene expression in bins
Space Ranger is used to count the UMI for each gene on every bin, obtaining a bin-gene expression matrix for the sample. After performing data QC, the figure below shows the distribution of UMI per gene across the spatial regions of the tissue.
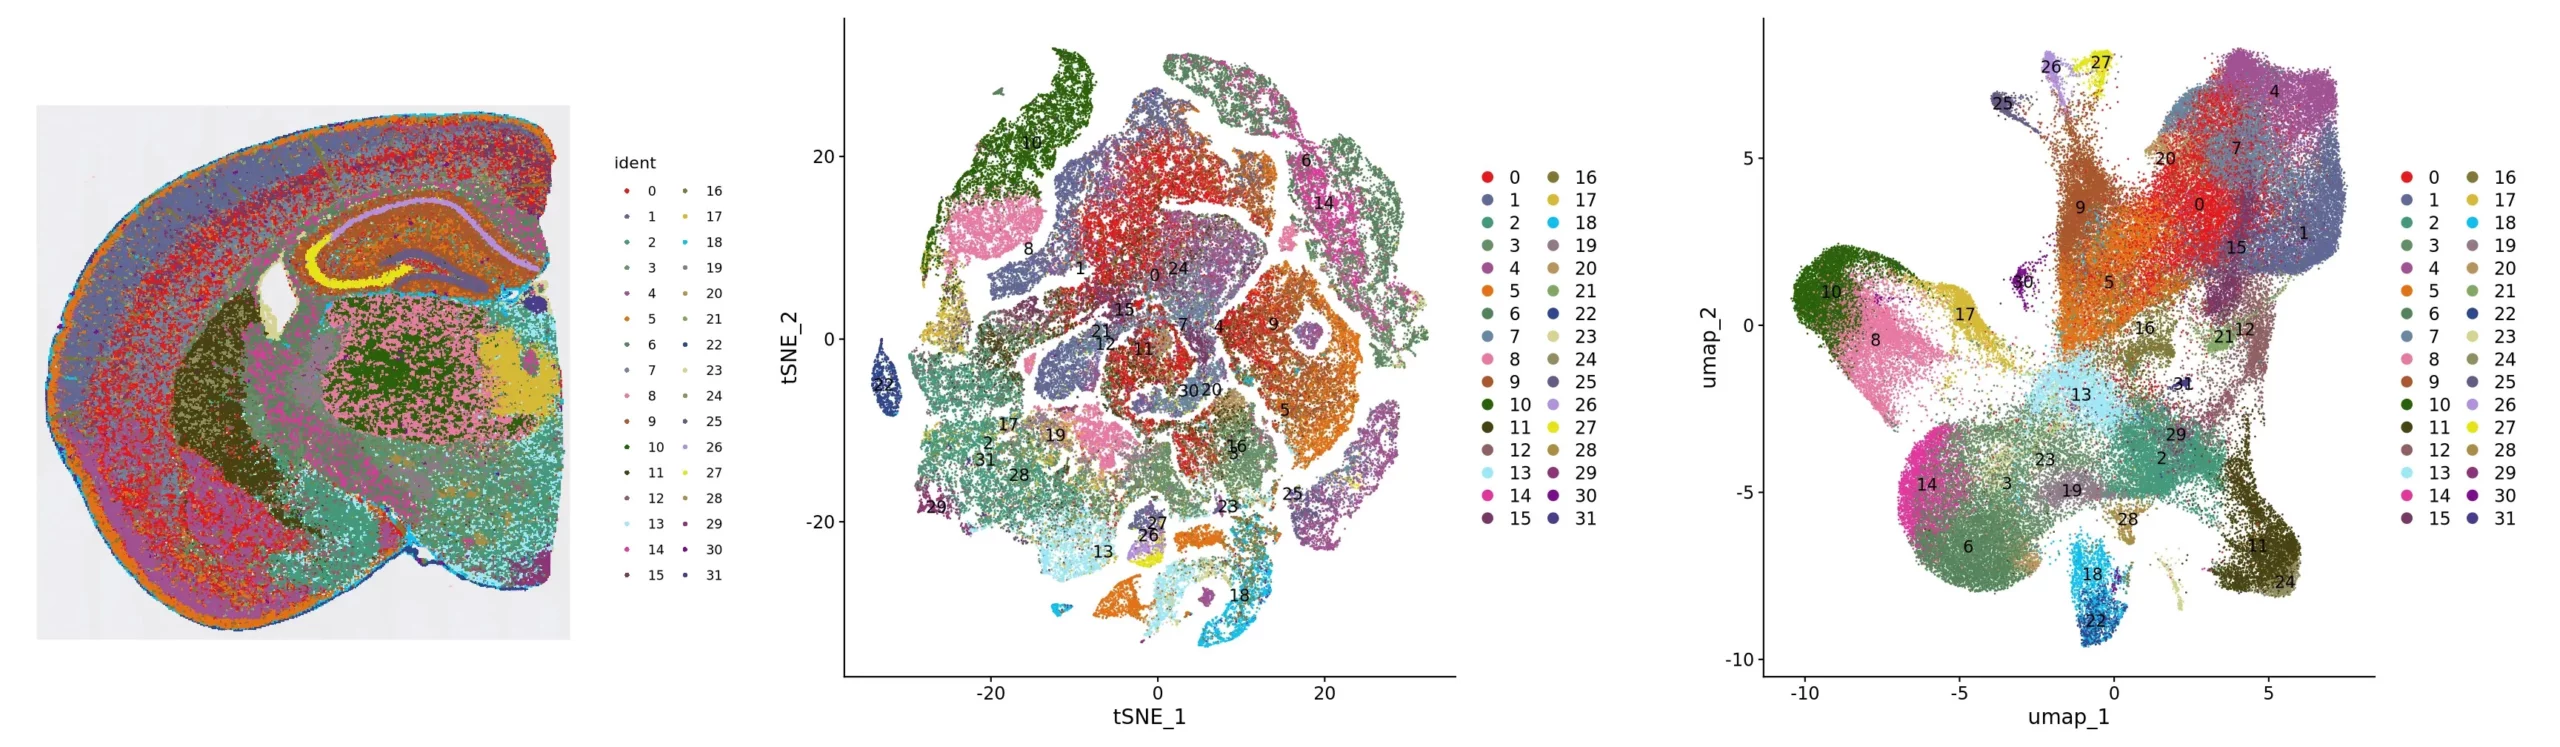
Figure 2. Clustering analysis presentation: spatial distribution, tSNE and UMAP
Cluster_Spatial: spatial distribution map of clusters; Cluster_tSNE: tSNE two-dimensional spatial representation map of clusters; Cluster_UMAP: UMAP two-dimensional spatial representation map of clusters
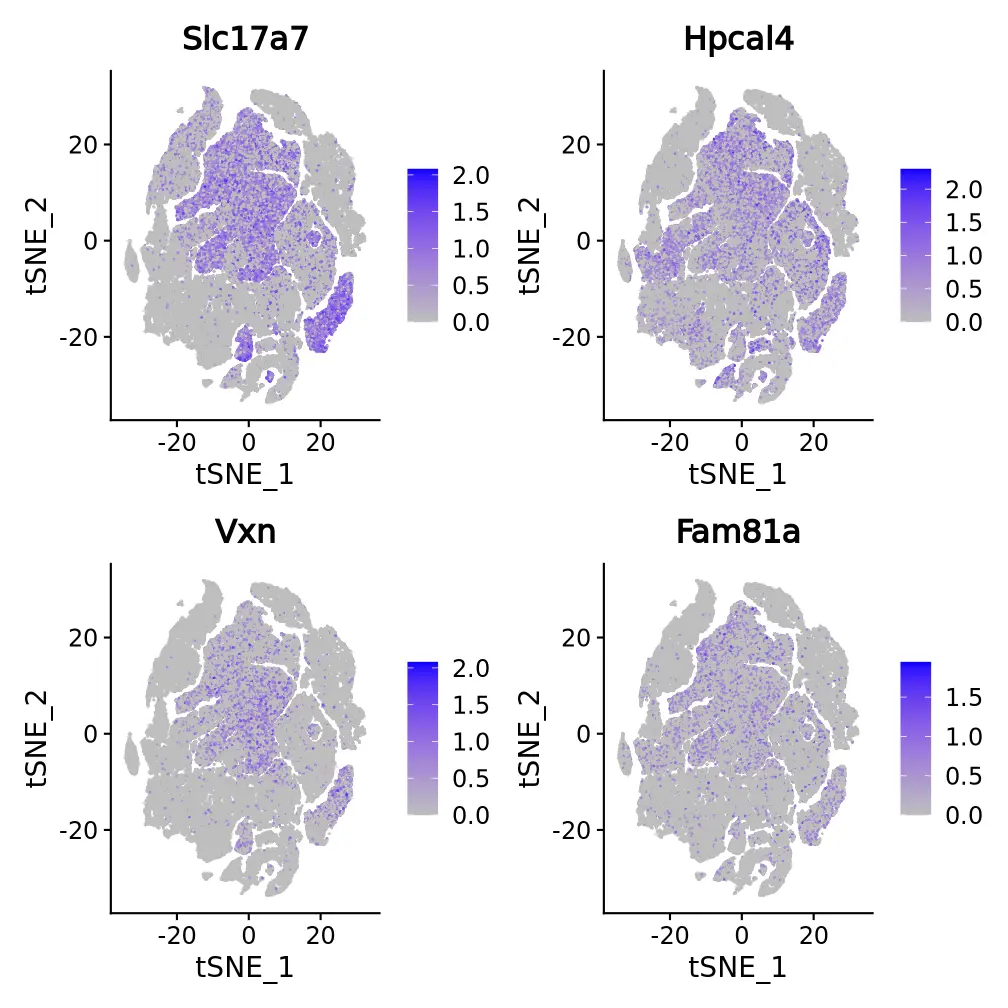
Figure 3. t-SNE and UMAP dimensionality reduction of differentially expressed genes
The top 4 differentially expressed genes of each cluster are displayed in several ways. The figure presents the t-SNE and UMAP dimensional reduction visualization of differentially expressed genes.