Introduction to Assay for Transposase-Accessible Chromatin using Sequencing (ATAC-seq)

ATAC-seq is a high-throughput sequencing method used to analyze genome-wide chromatin accessibility, which is crucial for understanding the global epigenetic regulation of gene expression. Chromatin accessibility refers to the extent to which nuclear macromolecules can interact with chromatinized DNA, enabling transcription and other biological processes. Consequently, ATAC-seq provides valuable insights into the genome’s regulatory landscape by identifying regions where DNA is accessible for binding by various cellular factors.
Leveraging Next Generation Sequencing (NGS) technology with the Illumina NovaSeq platform, Novogene’s ATAC-seq service enables researchers to investigate genome-wide chromatin accessibility, a key factor in gene expression regulation. During ATAC-seq library preparation, sequencing adapters are inserted into open chromatin regions using the hyperactive Tn5 transposase. This allows for the capture of all open chromatin regions under specific space-time conditions, without being restricted to the binding sites of transcription factors or specific histone-modified regions like ChIP-seq.
ATAC-seq Highlights
- Discover regions of open chromatin by profiling genome-wide active regions.
- ATAC-seq does not require prior knowledge of regulatory elements.
- Identify novel enhancers, promoters, and other regulatory elements involved in gene expression and function.
- Help to explore correlations between open chromatin regions and transcription factors.
Advantages of ATAC-seq with Novogene
- Flexible Sample Receiving Strategies: Accepts both cells and tissues with low starting amounts.
- Profound Experience: Successfully completed hundreds of ATAC-seq projects as of 2023 and 2024.
- Rapid and High Capacity: Industry-leading turnaround time.
- Comprehensive Bioinformatic Analysis: Provides publication-ready results and offers bioinformatic consultants for ATAC-seq data interpretation.
Latest Blogs
Applications of ATAC-seq
- Cancer research
- Drug discovery & development
- Rare & complex diseases
- Immuno-oncology
- Stem cells and developmental biology
ATAC-seq Specifications: Sample Requirements
| Sample Type | Required Amount (Qubit®) | Shipping Conditions |
| Frozen Tissue | ≥ 50mg (100mg is recommended) | Transport under dry ice conditions |
| Cryopreserved cell | ≥ 500k cells (1M is recommended) | Cryopreserved cells (in single cell suspension) should be shipped on dry ice. |
| Fresh Cell | Fresh cells stored in MACS Cell Storage Buffer, kept in single-cell suspension; Transport on ice packs (no dry ice for fresh cells) |
Refer to Data standards – ENCODE for more information about data amount and analysis process for ATAC-seq.
ATAC-seq Specifications: Sequencing and Analysis
| Sequencing Platform | Illumina NovaSeq Platform |
| Read Length | Paired-end 150 bp |
| Recommended Data Amount | 9-15 Gb per sample |
| Content of Data Analysis |
|
Project Workflow of Novogene ATAC-seq Service
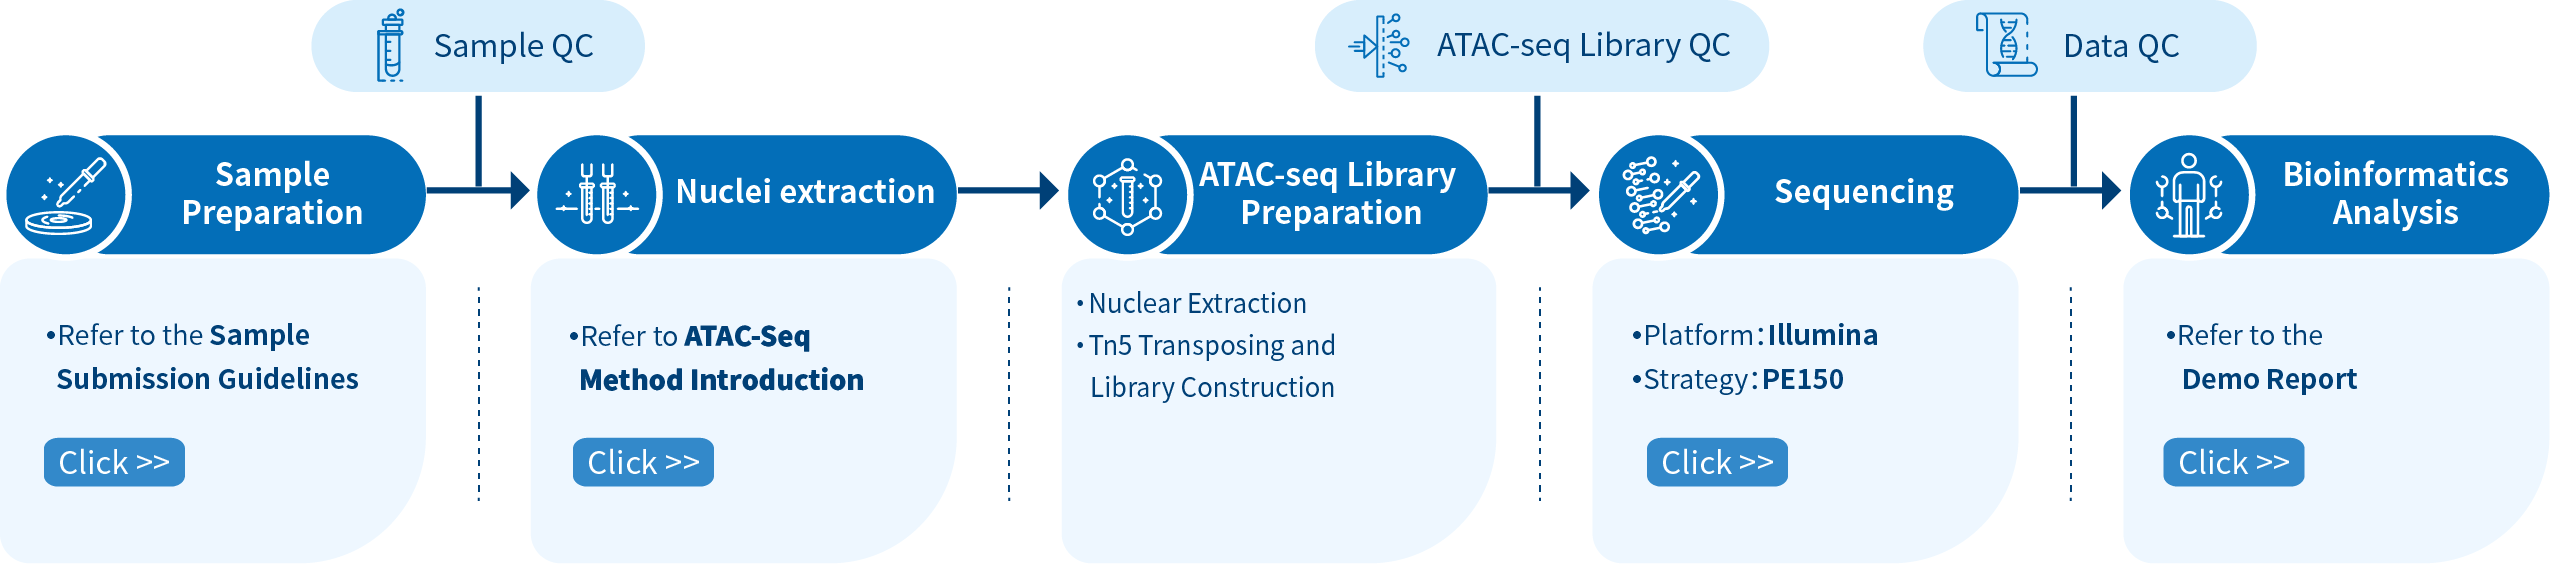
The Novogene ATAC-seq service comprises four steps: Sample preparation, library preparation, sequencing, and bioinformatics analysis. The workflow cannot be paused after sample thawing due to the nature of the initial samples (cells/tissues). Please contact us for more information about your ATAC-seq projects.
To guarantee the accuracy and reliability of sequencing data, Novogene audits every experimental step through quality control, fundamentally ensuring high-quality data output from sampling to the final data report. This commitment to high-quality data is essential for the correctness, comprehensiveness, and credibility of bioinformatics analysis.
Featured Publications using Novogene ATAC-seq Service
-
Nature CommunicationsIssue Date: 6 August 2024IF: 14.7DOI: 10.1038/s41467-024-51036-y
-
Airway hillocks are injury-resistant reservoirs of unique plastic stem cells
NatureIssue Date: 23 May 2024IF: 64.8DOI: 10.1038/s41586-024-07377-1
-
Cell Stem CellIssue Date: 30 April 2024IF: 23.9DOI: 10.1016/j.stem.2024.04.002
-
Nature Cell BiologyIssue Date: 7 February 2024IF: 21.3DOI: 10.1038/s41556-024-01351-9
-
Depletion of SAM leading to loss of heterochromatin drives muscle stem cell ageing
Nature MetabolismIssue Date: 1 January 2024IF: 20.8DOI: 10.1038/s42255-023-00955-z
Motif Analysis
Motif indicates the sequence conservation of the position of the peak, which may play a role in the regulation of gene expression.
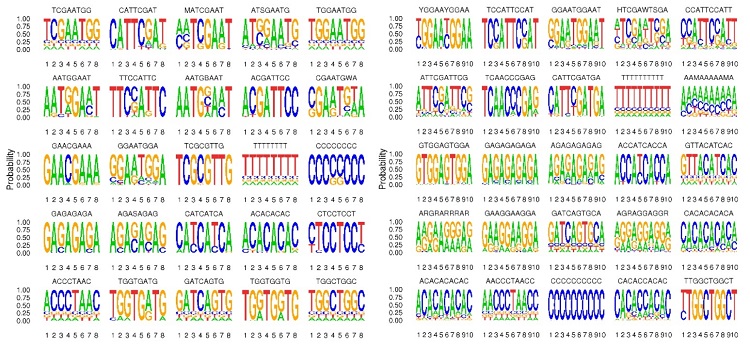
Note: The most significant 25 motifs of lengths 8, 10, 12, 14 were identified for each set of experiments.
More detailed information for each motif is available in the result file and the readme file.
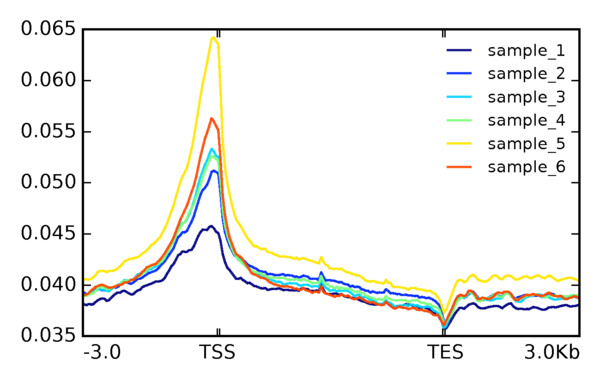
Distribution of ATAC-seq Reads Mapped to the Gene Body
Each gene, along with its 3kb upstream and 3kb downstream regions, is divided into bins according to the window size of 50bp. Full reports include additional analysis results related to the TSS (Transcription Start Site) following peak calling.
Peak Annotation
The distribution of peaks across various functional areas is shown below. The correspondence between peaks and functional areas follows the priority order of promoter, 5’UTR, 3’UTR, Exon, Intron, Downstream, and Intergenic. Additional enrichment analysis is also included in full reports.

Differential Analysis
GO and KEGG enrichment analysis annotate differential peaks between groups enriched in the biological process, cellular component, molecular function, and biological pathway.
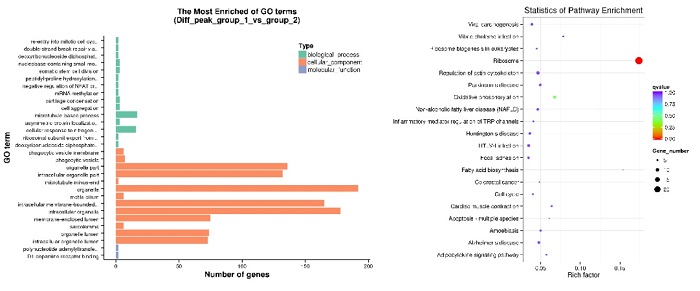
Note: Differential analysis can be performed between groups only when there are two or more groups.
*Please contact us to get the full demo report.