Service Overview

This assay applies the power of next-generation sequencing (NGS) to gene expression profiling of typical clinical samples. Based on the TruSeq RNA Exome Library Prep Kit and Novogene’s in-house bioinformatics pipelines, it provides robust and comprehensive transcriptomic analyses of human RNA isolated from FFPE and other low-quality clinical samples.
Advantages
- Comprehensive analytical validation from FFPE: RNA isolation to library construction to sequencing.
- Unsurpassed data quality with higher percentage of Q30, higher percentage of clean data and higher proportion of reads mapping to mRNA compared to poly(A) RNA-Seq.
- Extensive experience with hundreds of clinical FFPE samples analyzed.
- Comprehensive data analysis using widely accepted mainstream software and mature in-house pipelines. Our professional bioinformatics team offers standard, advanced, and customized analysis tailored to your needs.
FFPE RNA-Seq Service Overview
Testing Workflow

Sample Requirements
| Sample Type | Sample Requirement |
| FFPE | Approximately ten 4-μm sections, each with tissue area ≥ 25mm2 and tumor content ≥ 20% |
| Extracted RNA | ≥ 200 ng of purified RNA; Minimal volume ≥ 20 µL; RNA concentration(quantified by Qubit): ≥ 20 ng/μL; OD260/280 > 2.0, without degradation or DNA contamination |
Sequencing Strategy
NovaSeq 6000, PE150
Data Quality Guarantee
We guarantee that ≥ 80% of bases have a sequencing quality score ≥ Q30, which exceeds Illumina’s official guarantee of ≥ 75%.
Recommended Sequencing Depth
40 M reads
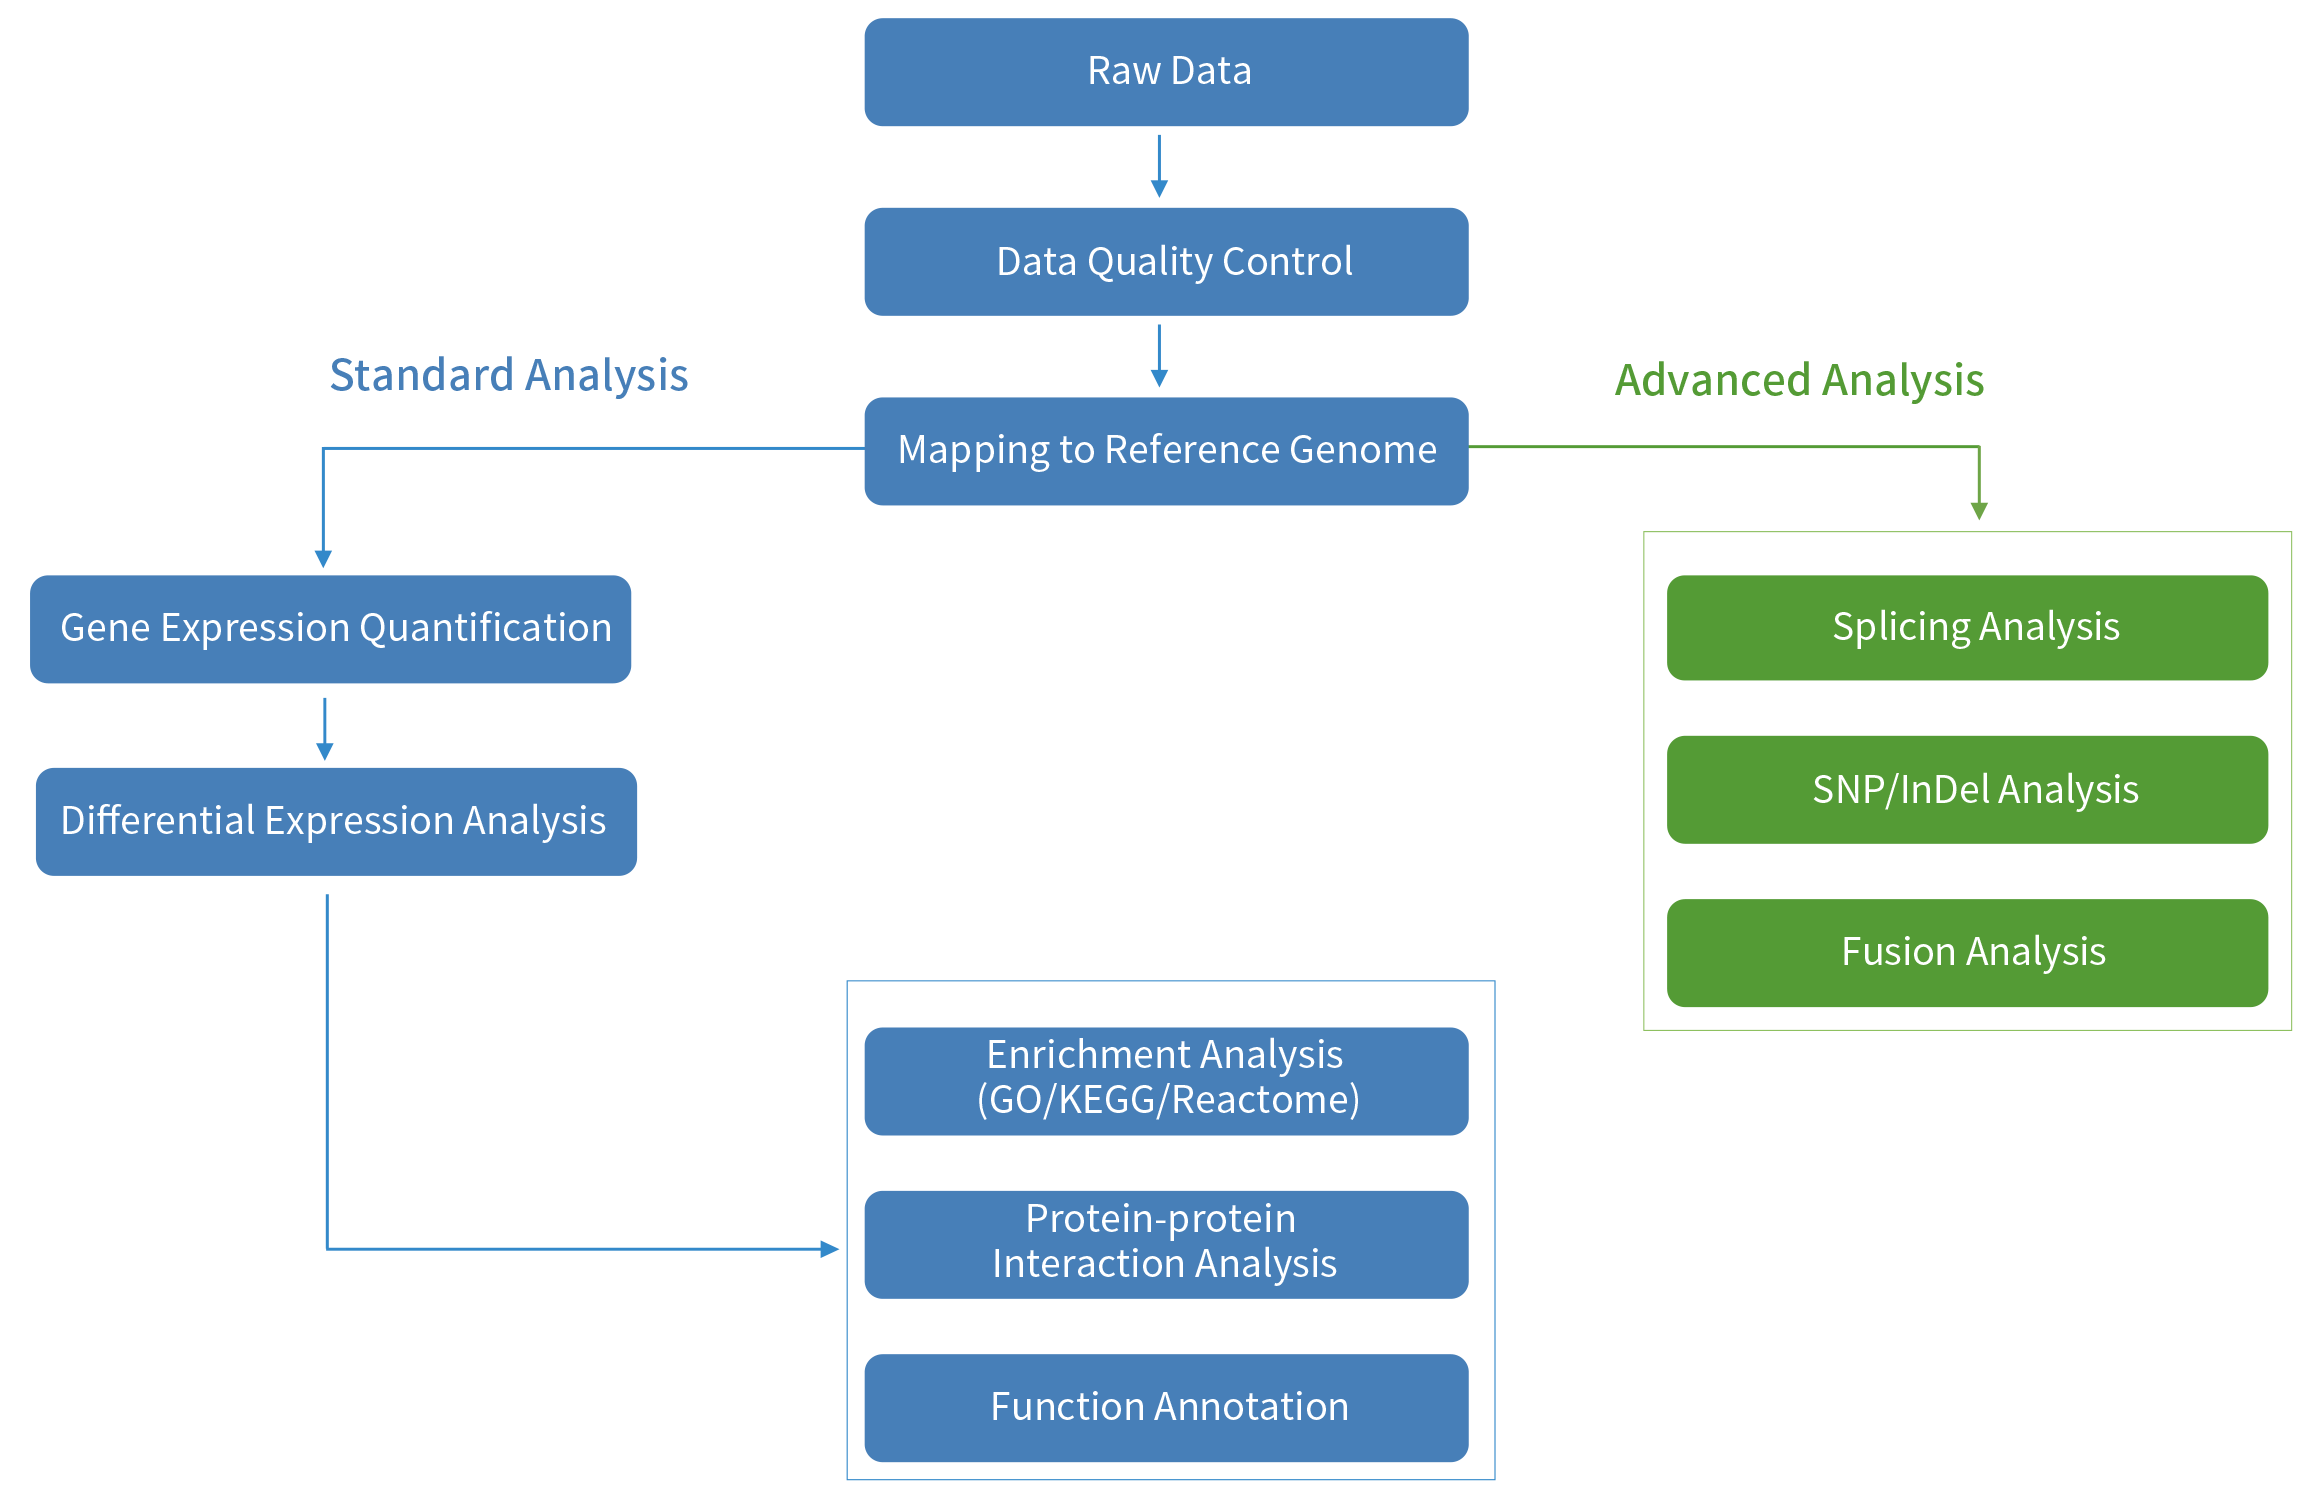
FFPE RNA-Seq Bioinformatics Analyses Workflow

Novogene Data
Extensive Experience
Compared to poly(A) RNA-Seq, this workflow is superior on multiple aspects of data quality metrics with higher percentage of clean data, lower error rate, higher Q30 and lower percentage of rRNA reads.
We have analyzed hundreds of FFPE samples with this RNA-Seq assay. Table 1 provides an example of the data quality metrics from those analyses.
Table 1. Examples of data quality metrics from FFPE samples analysed with this assay.
| Sample ID | Total Exonic Mapping Rate (%) | Clean Data (%) | Error Rate (%) | Q30 (%) | rNDA (%) |
| 1 | 86.01 | 99.61 | 0.02 | 95.16 | 0.09 |
| 2 | 85.55 | 99.33 | 0.02 | 94.6 | 0.13 |
| 3 | 85.45 | 99.25 | 0.02 | 94.24 | 0.15 |
| 4 | 85.32 | 99.48 | 0.02 | 95.53 | 0.03 |
| 5 | 85.06 | 96.94 | 0.02 | 96.78 | 0.06 |
| 6 | 84.76 | 96.56 | 0.02 | 96.84 | 0.03 |
| 7 | 84.76 | 99.35 | 0.02 | 95.01 | 0.09 |
| 8 | 84.74 | 99.34 | 0.02 | 94.81 | 0.05 |
| 9 | 84.16 | 96.61 | 0.02 | 96.84 | 0.07 |
| 10 | 84.09 | 96.62 | 0.02 | 96.88 | 0.03 |
For Research Use Only. The content provided herein may relate to products that have not been approved by the regulatory authorities of where this document is circulated. The clinical application of such products should thus be limited to research only. The content of this document is subject to change without notice. © 2019 Novogene Co., Ltd. All rights reserved. All trademarks are the property of Novogene Co., Ltd. and its subsidiaries unless otherwise specified.
Sample Heading
Sample sub heading
