Spatial transcriptome sequencing enables comprehensive mapping of gene expression within the intact tissue architecture, preserving the morphological context of FFPE or frozen samples. We offer spatial profiling utilizing the 10X Genomics® Visium HD® platform and SpaTial Enhanced REsolution Omics-sequencing (Stereo-seq), providing whole-transcriptome coverage at high resolution to uncover cellular heterogeneity, tissue organization, and disease-specific microenvironments.
Together with our epigenetic and single-cell sequencing solutions, this integrated multi-omics approach empowers researchers to explore gene regulation across molecular dimensions, bridging spatial context with cell-type-specific resolution for a holistic understanding of complex biological systems.
Sample Requirements
| Service | Sample Type | Amount | Preservation | RNA QC | Shipping |
| 10x Visium HD Spatial Transcriptome Sequencing |
FFPE block (Human/Mouse) |
1 block, contained on plastic dehydrating box. | After embedding store at 4°C, protected from light | DV200%≥30 % | 4°C or Room Temperature |
| FFPE slide (Human/Mouse) | 5-10 FFPE (10μm thickness) scrolls in tube for RNA QC; 2-4 FFPE (5μm thickness) tissue sections on glass slides, store in Slide Mailer, for library prep* |
Dry and sealed, storage time at 4°C < 14 days | 4°C or Room Temperature | ||
| Stereo-seq OMNI | FFPE block (Animal with reference genome) |
1 block, contained on plastic dehydrating box. | After embedding store at 4°C, protected from light | 4°C or Room Temperature | |
| FFPE section (Animal with reference genome) |
5-10 FFPE (10μm thickness) scrolls in 1.5ml tube for RNA QC; 4-6 FFPE (5μm thickness) tissue sections in 50ml centrifuge tube, for library prep* |
Dry and sealed, storage time at 4°C < 14 days | 4°C or Room Temperature |
*FFPE glass slides must be positive charged glass slides.
Specifications: Sequencing and Analysis
| Visium HD | Stereo-Seq | |
| Species | Human or mouse | No species limitation |
| Resolution | 2 um (single cell level) | 0.5-0.6 µm |
| Sequencing platform | NovaSeq x plus | DNB-Seq |
| Read length | PE150 | PE75 |
| Recommended Data Amount | 300M read pairs ~ 100Gb/ sample | 2.5B reads per sample |
| analysis |
|
|
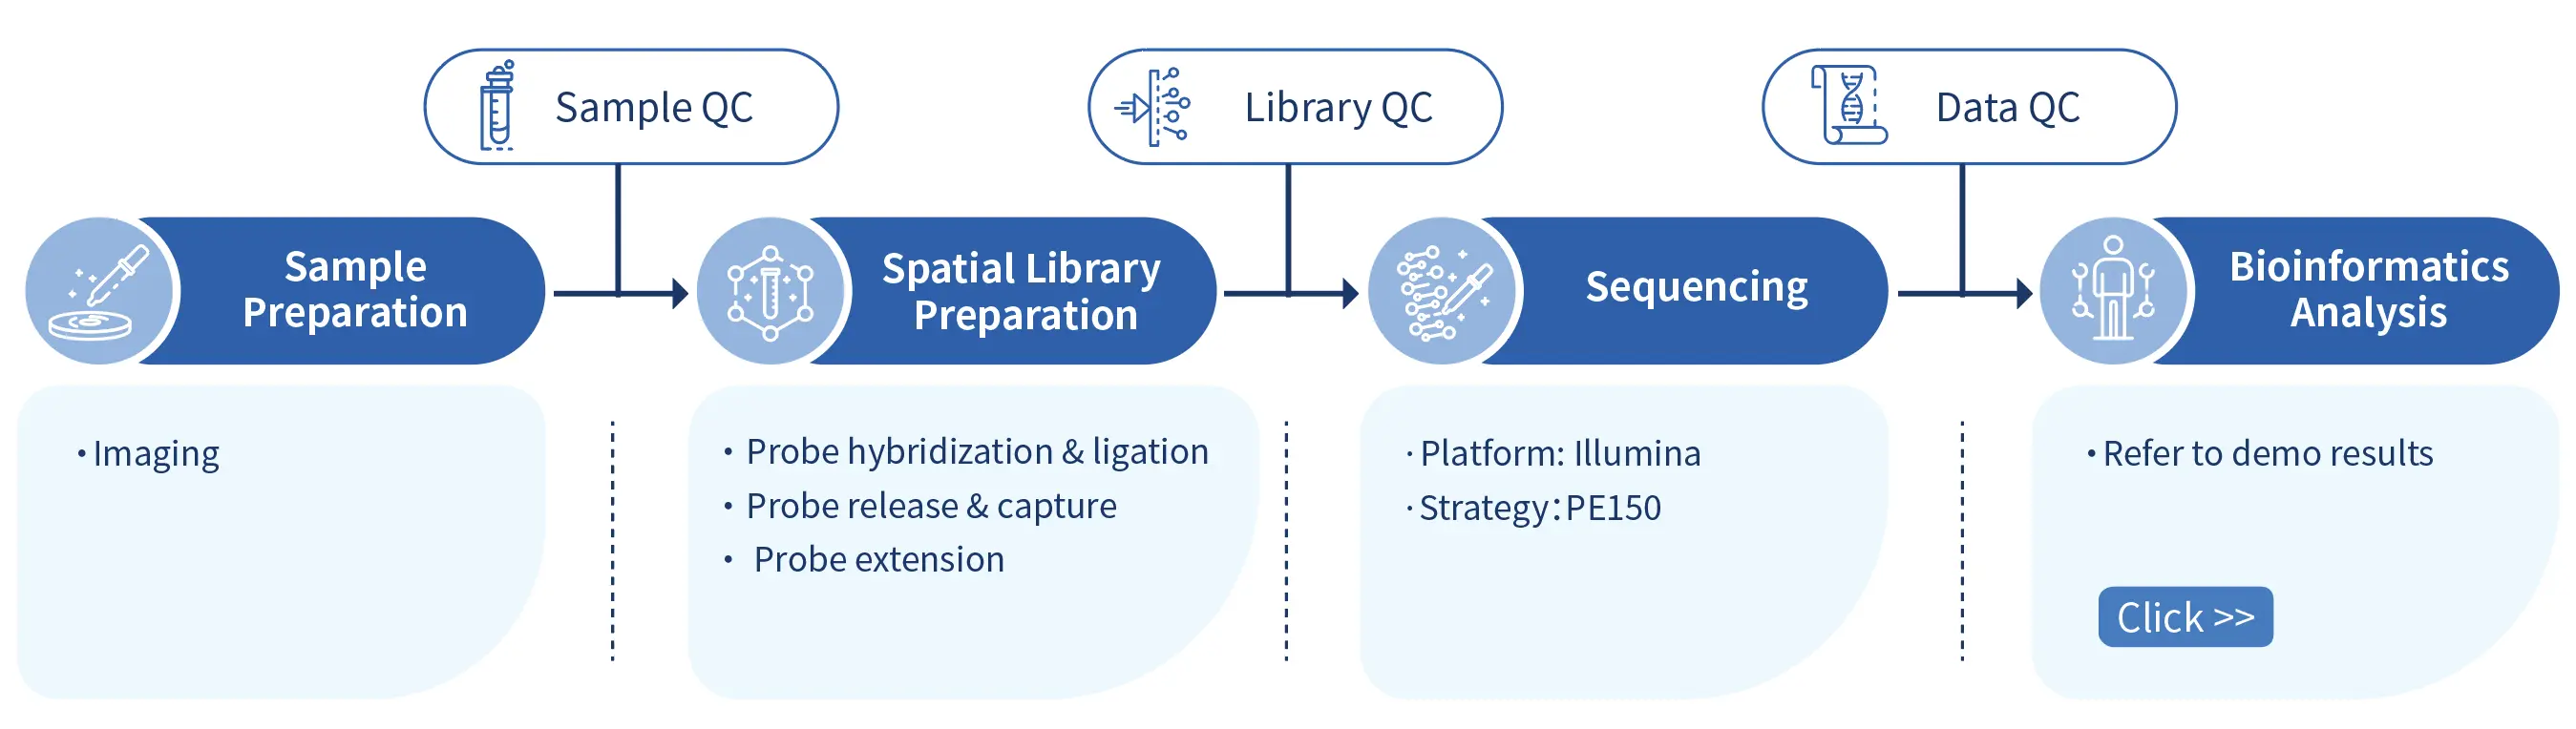
Project Workflow
Demo Results of Bioinformatics Analysis
Contact us for a demo report.
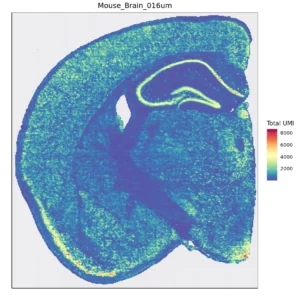
Figure 1. Spatial quantification of gene expression in bins
Space Ranger is used to count the UMI for each gene on every bin, obtaining a bin-gene expression matrix for the sample. After performing data QC, the figure below shows the distribution of UMI per gene across the spatial regions of the tissue.
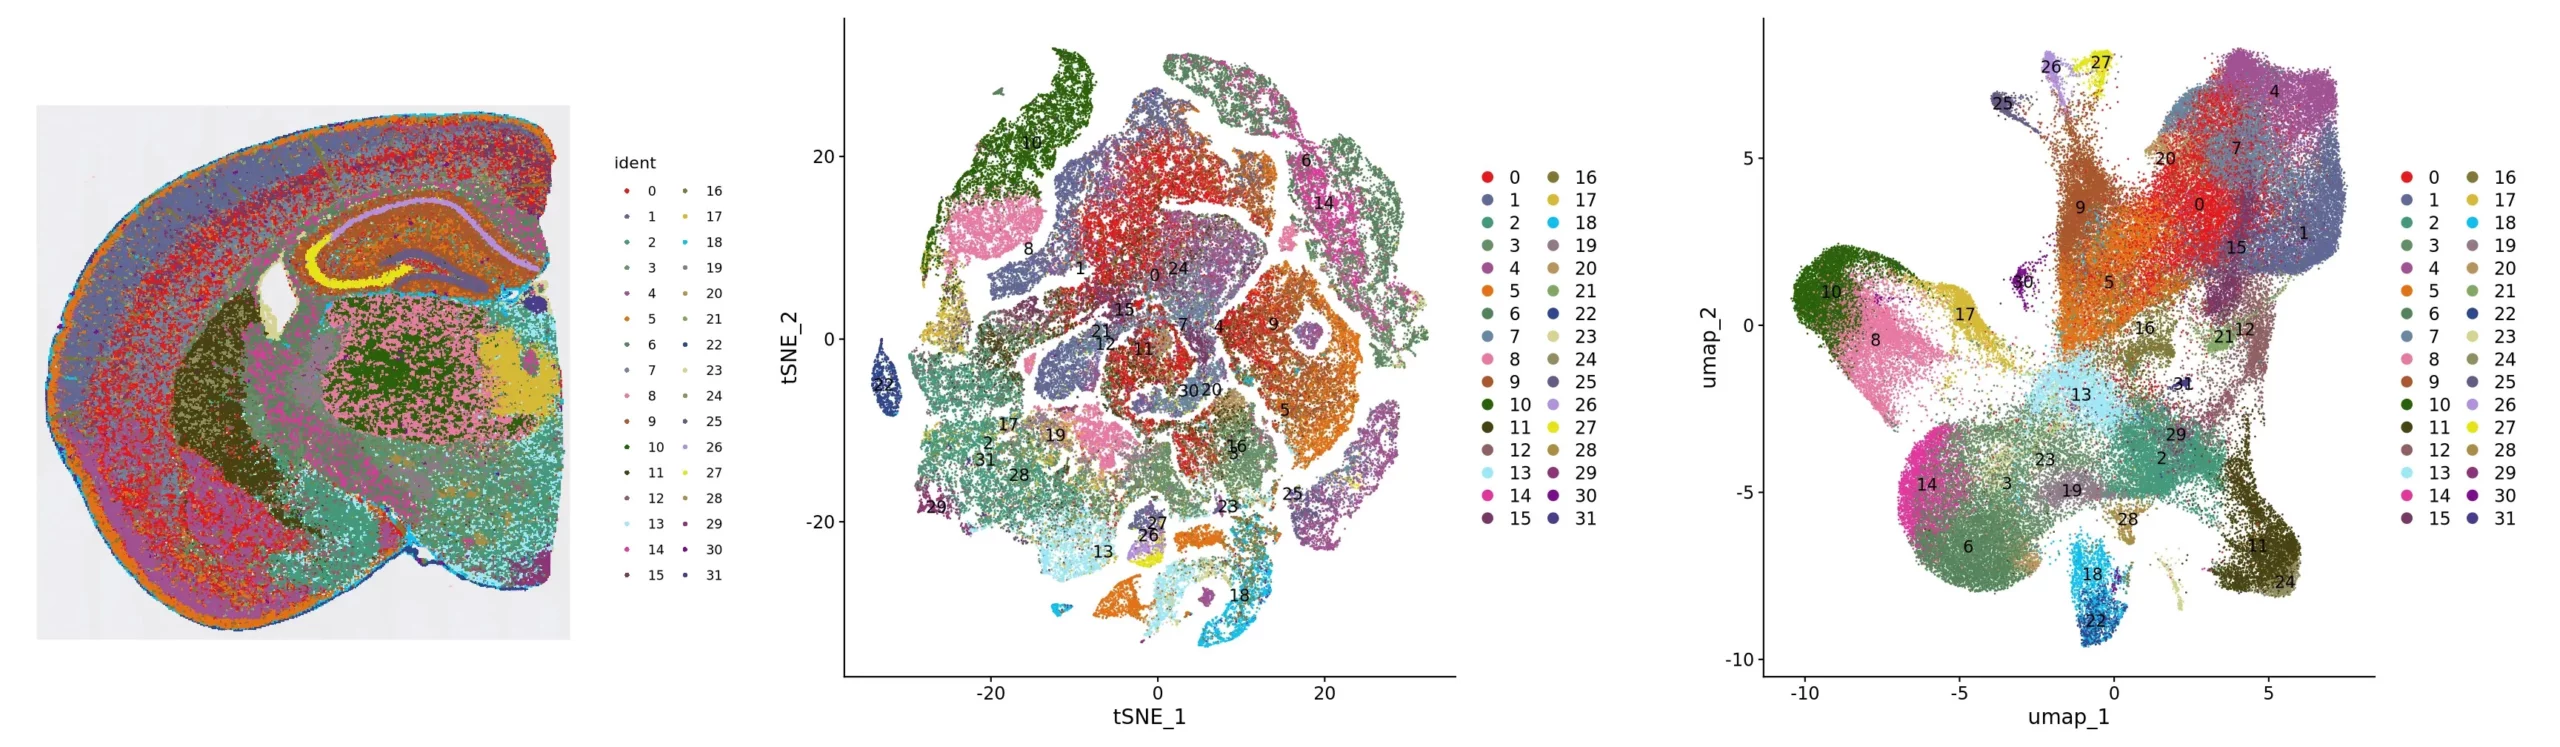
Figure 2. Clustering analysis presentation: spatial distribution, tSNE and UMAP
Cluster_Spatial: spatial distribution map of clusters; Cluster_tSNE: tSNE two-dimensional spatial representation map of clusters; Cluster_UMAP: UMAP two-dimensional spatial representation map of clusters
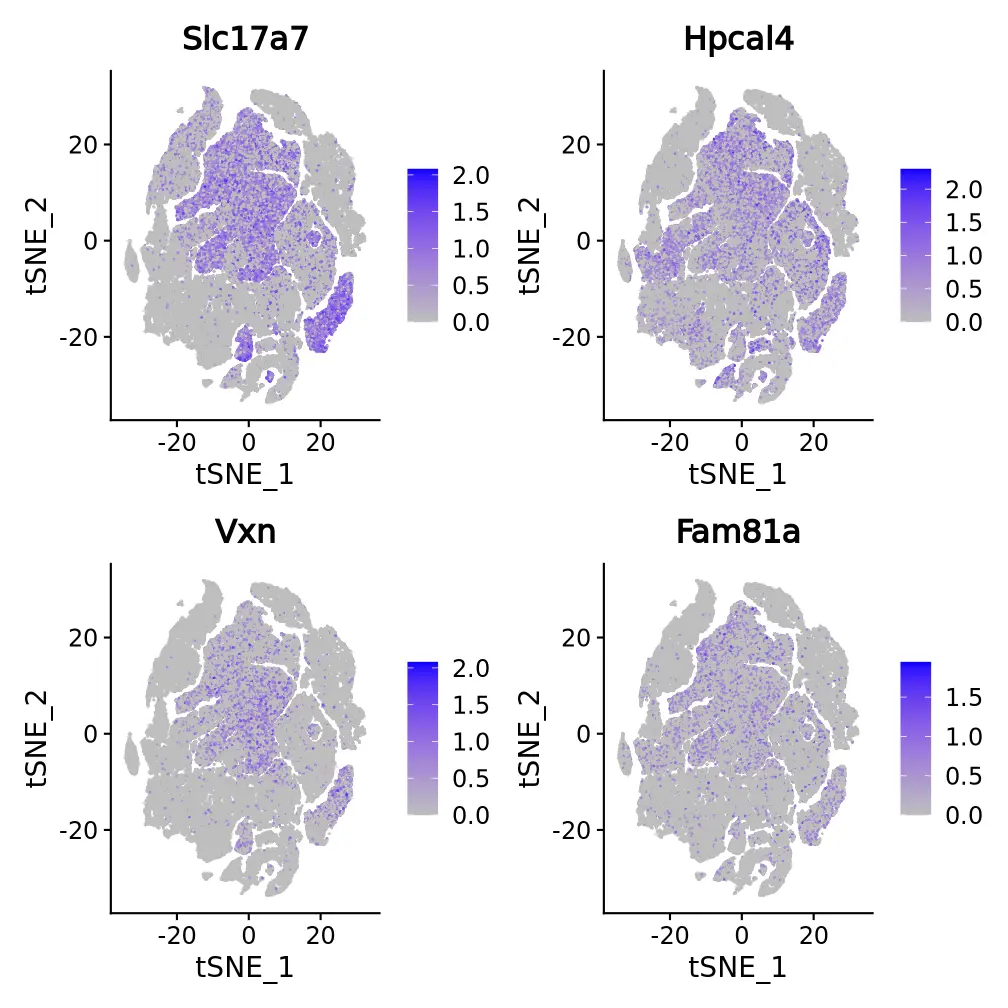
Figure 3. t-SNE and UMAP dimensionality reduction of differentially expressed genes
The top 4 differentially expressed genes of each cluster are displayed in several ways. The figure presents the t-SNE and UMAP dimensional reduction visualization of differentially expressed genes.