10x Genomics Single Cell Sequencing

Single-cell Sequencing (single-cell RNA-Seq or scRNA-Seq or scV(D)J/TCR/BCR-seq, scATAC-Seq) can reveal cell-to-cell differences and cellular heterogeneities that have been completely obscured by bulk sequencing, thus enabling a high-resolution exploration of the function of individual cells. Single-cell sequencing has a wide range of applications across biology and medicine, offering unprecedented insights into cellular behavior and function.
Based on the Miltenyi gentleMACS™ Octo Dissociator, 10x Genomics® Chromium™ X technology, Illumina® NovaSeq™ X Plus platform and Ultima UG 100 platform, Novogene from an expertise perspective offers comprehensive Single-cell RNA Sequencing (single-cell RNA-Seq or scRNA-Seq) solutions from sample processing, library preparation, sequencing to bioinformatic analysis at a cost-effective, competitive price and in a customer-focused manner, allowing you to explore the transcriptome and immune profiling cell-by-cell in the sea of cells.
Why Choose Novogene for 10x Single Cell Sequencing?
- Proven Expertise: With over 200,000 successfully sequenced samples, Novogene delivers great project results at industry-leading turnaround times. We excel in handling challenging sample types, including nerve and adipose cells.
- Enhanced Sample Processing: We offer a diverse range of sample processing capabilities, including nuclei extraction and specialized pipelines for frozen tissues. This ensures high-quality data in single-cell sequencing projects.
- Certified Excellence: As a 10x Genomics Certified Service Provider, we leverage the advanced Chromium X platform combined with GEM-X technology for superior reproducibility and efficiency.
- Cost-Effective Solutions: We have state-of-the-art high throughput sequencing platforms, coupled with expert support, ensure exceptional data quality and provide cost-effective solutions for single-cell projects.


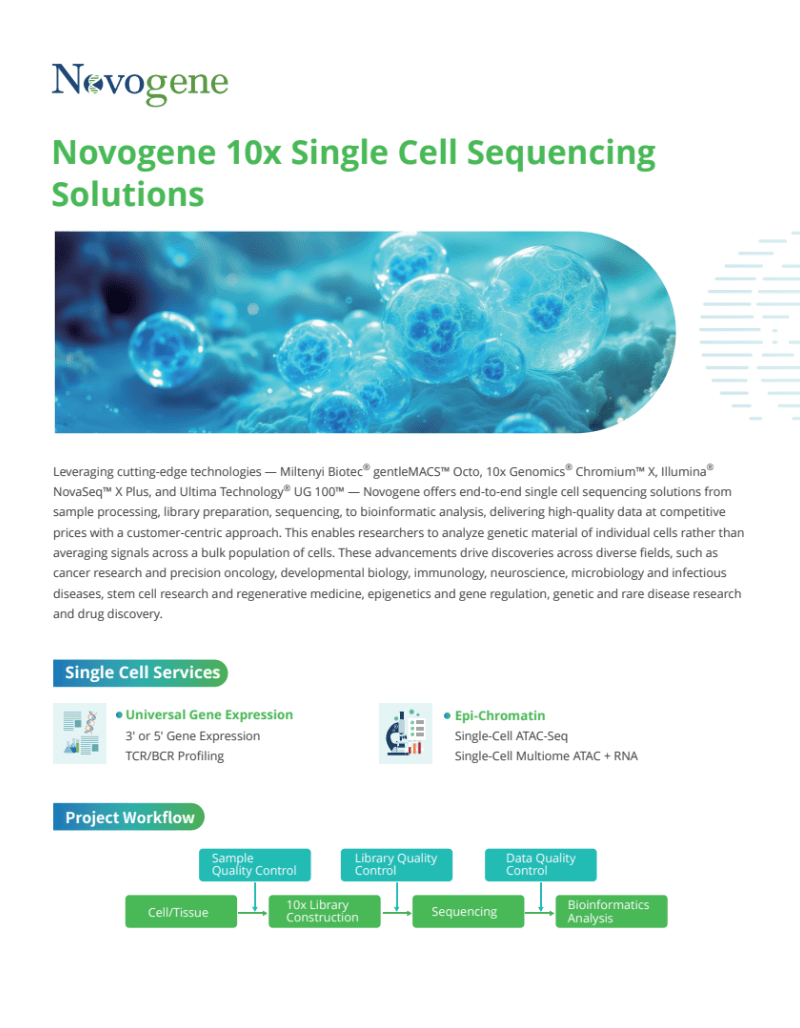
10x Single Cell Sequencing Solutions at Novogene
- 10x Single Cell RNA-Seq (scRNA-seq): Powered by the 10x Chromium Single Cell 3′ Gene Expression technology, the single cell RNA sequencing solution enables RNA capture and sequencing from individual cells to study gene expression patterns and cellular heterogeneity in single cell resolution. With the latest GEM-X technology and enhanced reagent kits, it delivers improved cell/nuclei capture efficiency, greater gene sensitivity, and higher throughput.
- 10x Single Cell Immune Profiling: 10x Chromium Single Cell Immune Profiling facilitates simultaneous analysis of full-length, paired B-cell or T-cell receptor (BCR/TCR) sequences and 5’ gene expression from individual cells. It uncovers insights into T and B cell diversity, V(D)J recombination, and immune cell profiling, advancing research in basic science and personalized medicine.
- 10x Single Cell ATAC-Seq: Chromium Single Cell ATAC (Assay for Transposase Accessible Chromatin) sequencing identifies thousands of unique open chromatin fragments genome-wide, at single-cell resolution. This technology reveals gene regulatory elements and provides insights into gene expression dynamics and cellular processes.
- 10x Single Cell Multiome ATAC + RNA:Epi Multiome ATAC + Gene Expression assay assay combines ATAC and 3′ gene expression sequencing from individual cell nuclei, providing insights into chromatin accessibility and transcriptomics in a single experiment. By linking epigenomic regulation with gene expression, it enables a deeper understanding of cell differentiation, development, and disease mechanisms.
Sample Specification for 10x Single Cell Sequencing
|
Species*:
*Contact us for species-specific recommendations and tissue type guidance. |
|
Sample Type**:
**Sample type preferences may vary based on sequencing requirements and sample compatibility. |
Sequencing Specification for 10x Single Cell Sequencing
| Sequencing Platform | Illumina NovaSeq X-Plus | Ultima UG100 | |
| Recommended Data | 5,000-20,000 cell/sample and 20,000 – 50,000 read pairs/cell | ||
| Raw Data Format | FASTQ files | ||
| Analysis | Cell Ranger Analysis |
|
|
| Standard Analysis |
|
||
| Advanced Analysis |
|
||
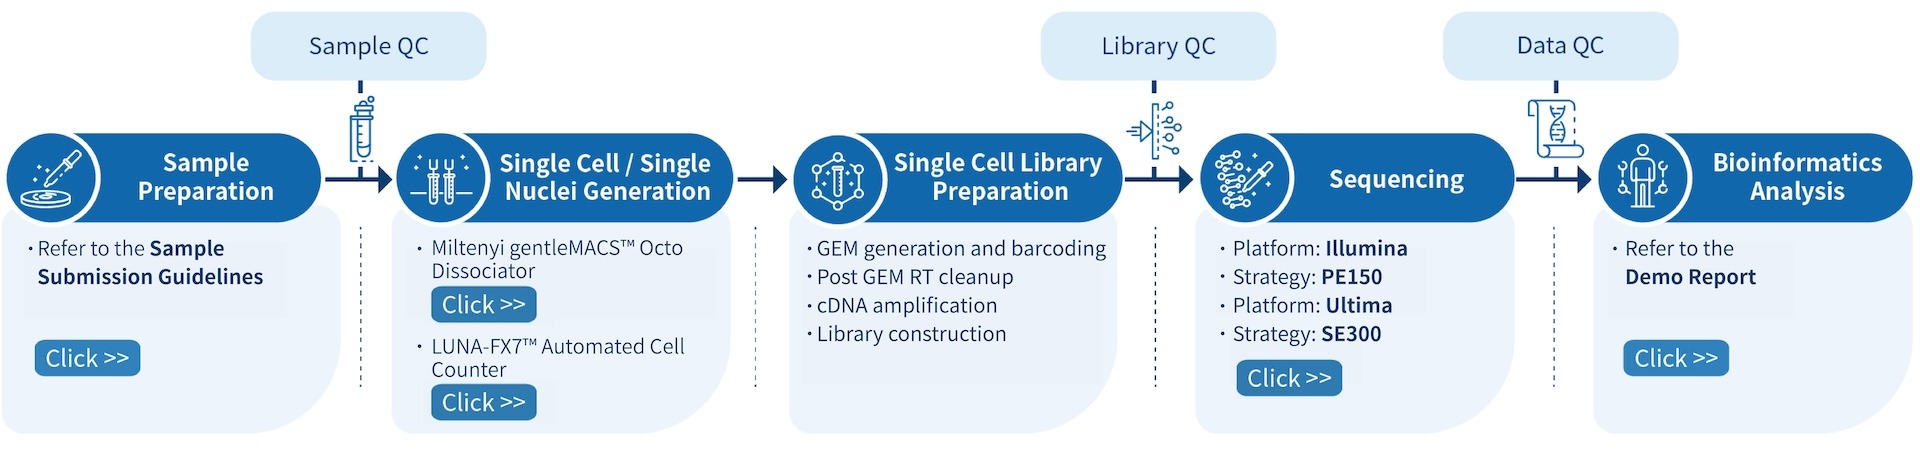
Project Workflow for Single-cell RNA Sequencing (single-cell RNA-Seq or scRNA-Seq)
From sample preparation, library preparation, sequencing and data quality control, to bioinformatics analysis, Novogene provides high-quality products and professional services. Each step is performed in agreement with a high scientific standard and meticulous design to ensure high-quality research results.
Featured publications of 10x Single Cell Sequencing
Case Studies


-
Dysregulation of brain and choroid plexus cell types in severe COVID-19
Yang, A.C., Kern, F., Losada, P.M. et al. Dysregulation of brain and choroid plexus cell types in severe COVID-19. Nature 595, 565–571 (2021). https://doi.org/10.1038/s41586-021-03710-0
-
GD2-CAR T cell therapy for H3K27M-mutated diffuse midline gliomas
Majzner, R.G., Ramakrishna, S., Yeom, K.W. et al. GD2-CAR T cell therapy for H3K27M-mutated diffuse midline gliomas. Nature 603, 934–941 (2022). https://doi.org/10.1038/s41586-022-04489-4
-
Wang, H., Liu, C., Xie, X., Niu, M., Wang, Y., Cheng, X., Zhang, B., Zhang, D., Liu, M., Sun, R., Ma, Y., Ma, S., Wang, H., Zhu, G., Lu, Y., Huang, B., Su, P., Chen, X., Zhao, J., Wang, H., … Cheng, T. (2023). Multi-omics blood atlas reveals unique features of immune and platelet responses to SARS-CoV-2 Omicron breakthrough infection. Immunity, 56(6), 1410–1428.e8. https://doi.org/10.1016/j.immuni.2023.05.007
Demo Results
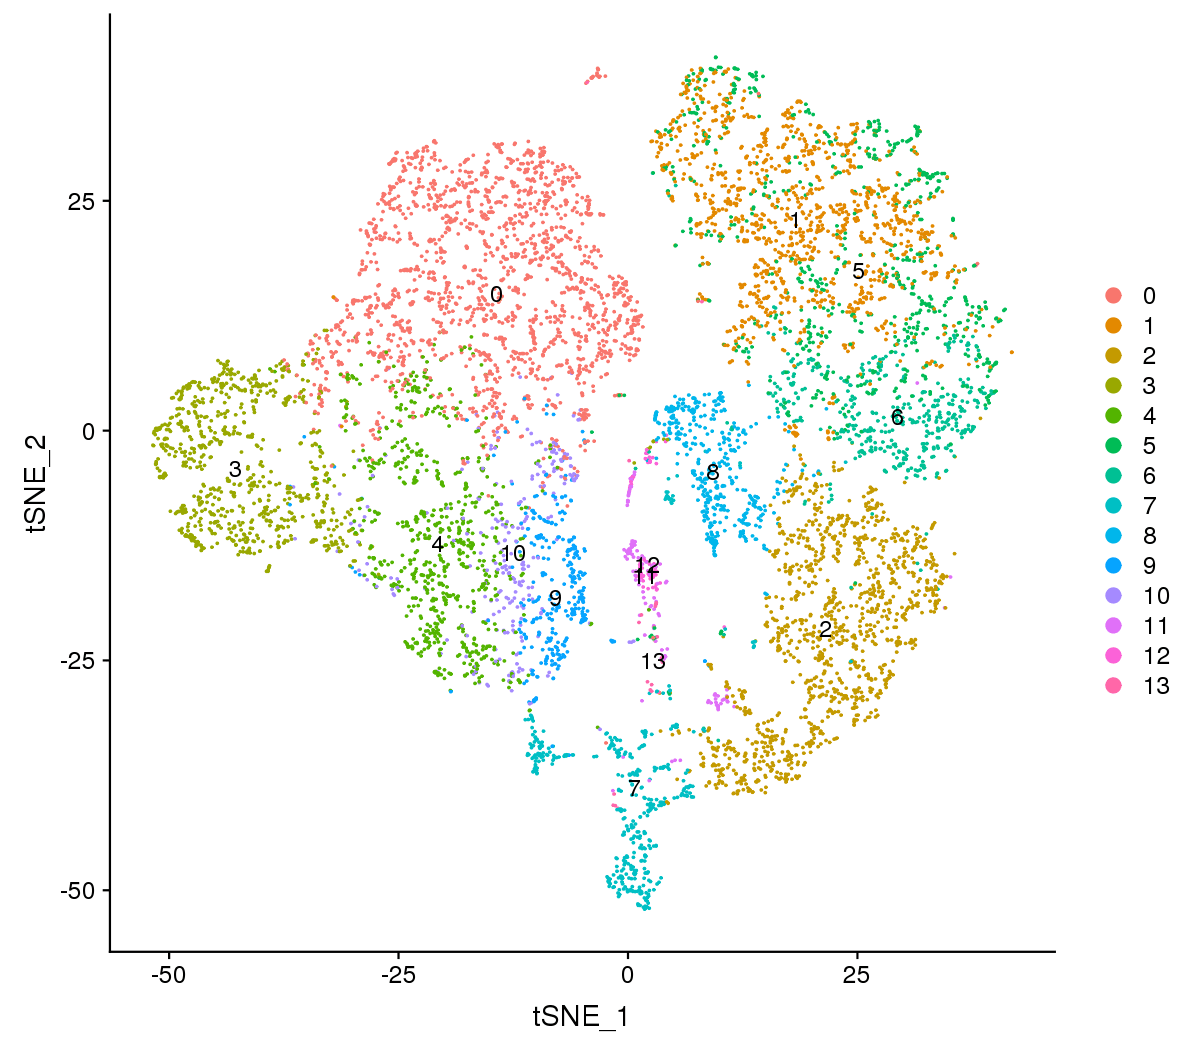
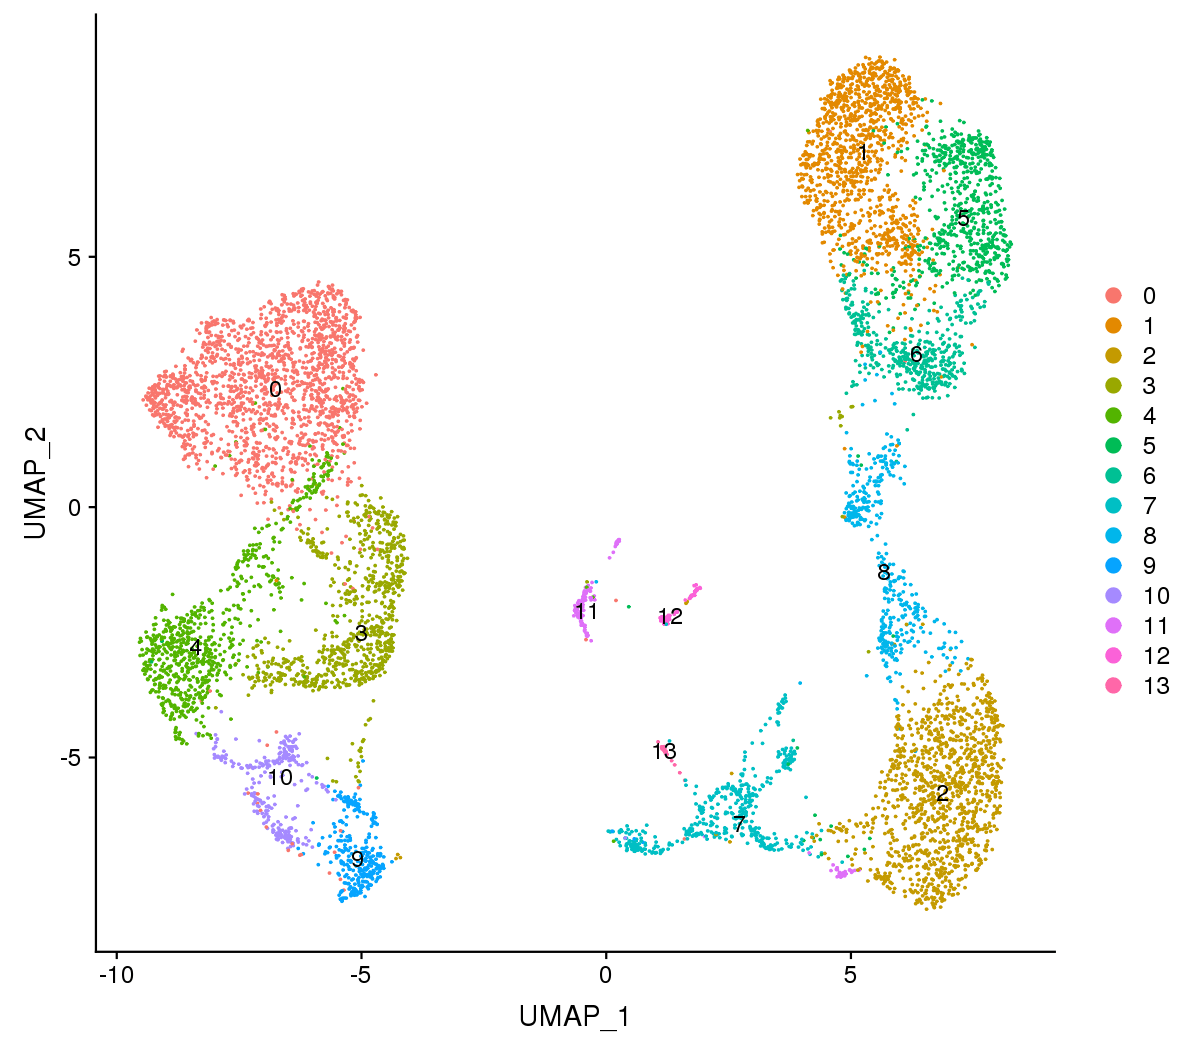
Figure 1 The t-SNE and UMAP plots
Note:Each point represents a cell, and each color designates a cluster.
For visualization purposes, dimensionality was further reduced to 2D using t-distributed stochastic neighbor embedding (t-SNE) and uniform manifold approximation and projection (UMAP). Both of them try to find a low-dimensional representation that preserves relationships between neighbors in high-dimensional space. Compared to t-SNE, the UMAP visualization tends to have more compact visual clusters with more empty spaces between them.
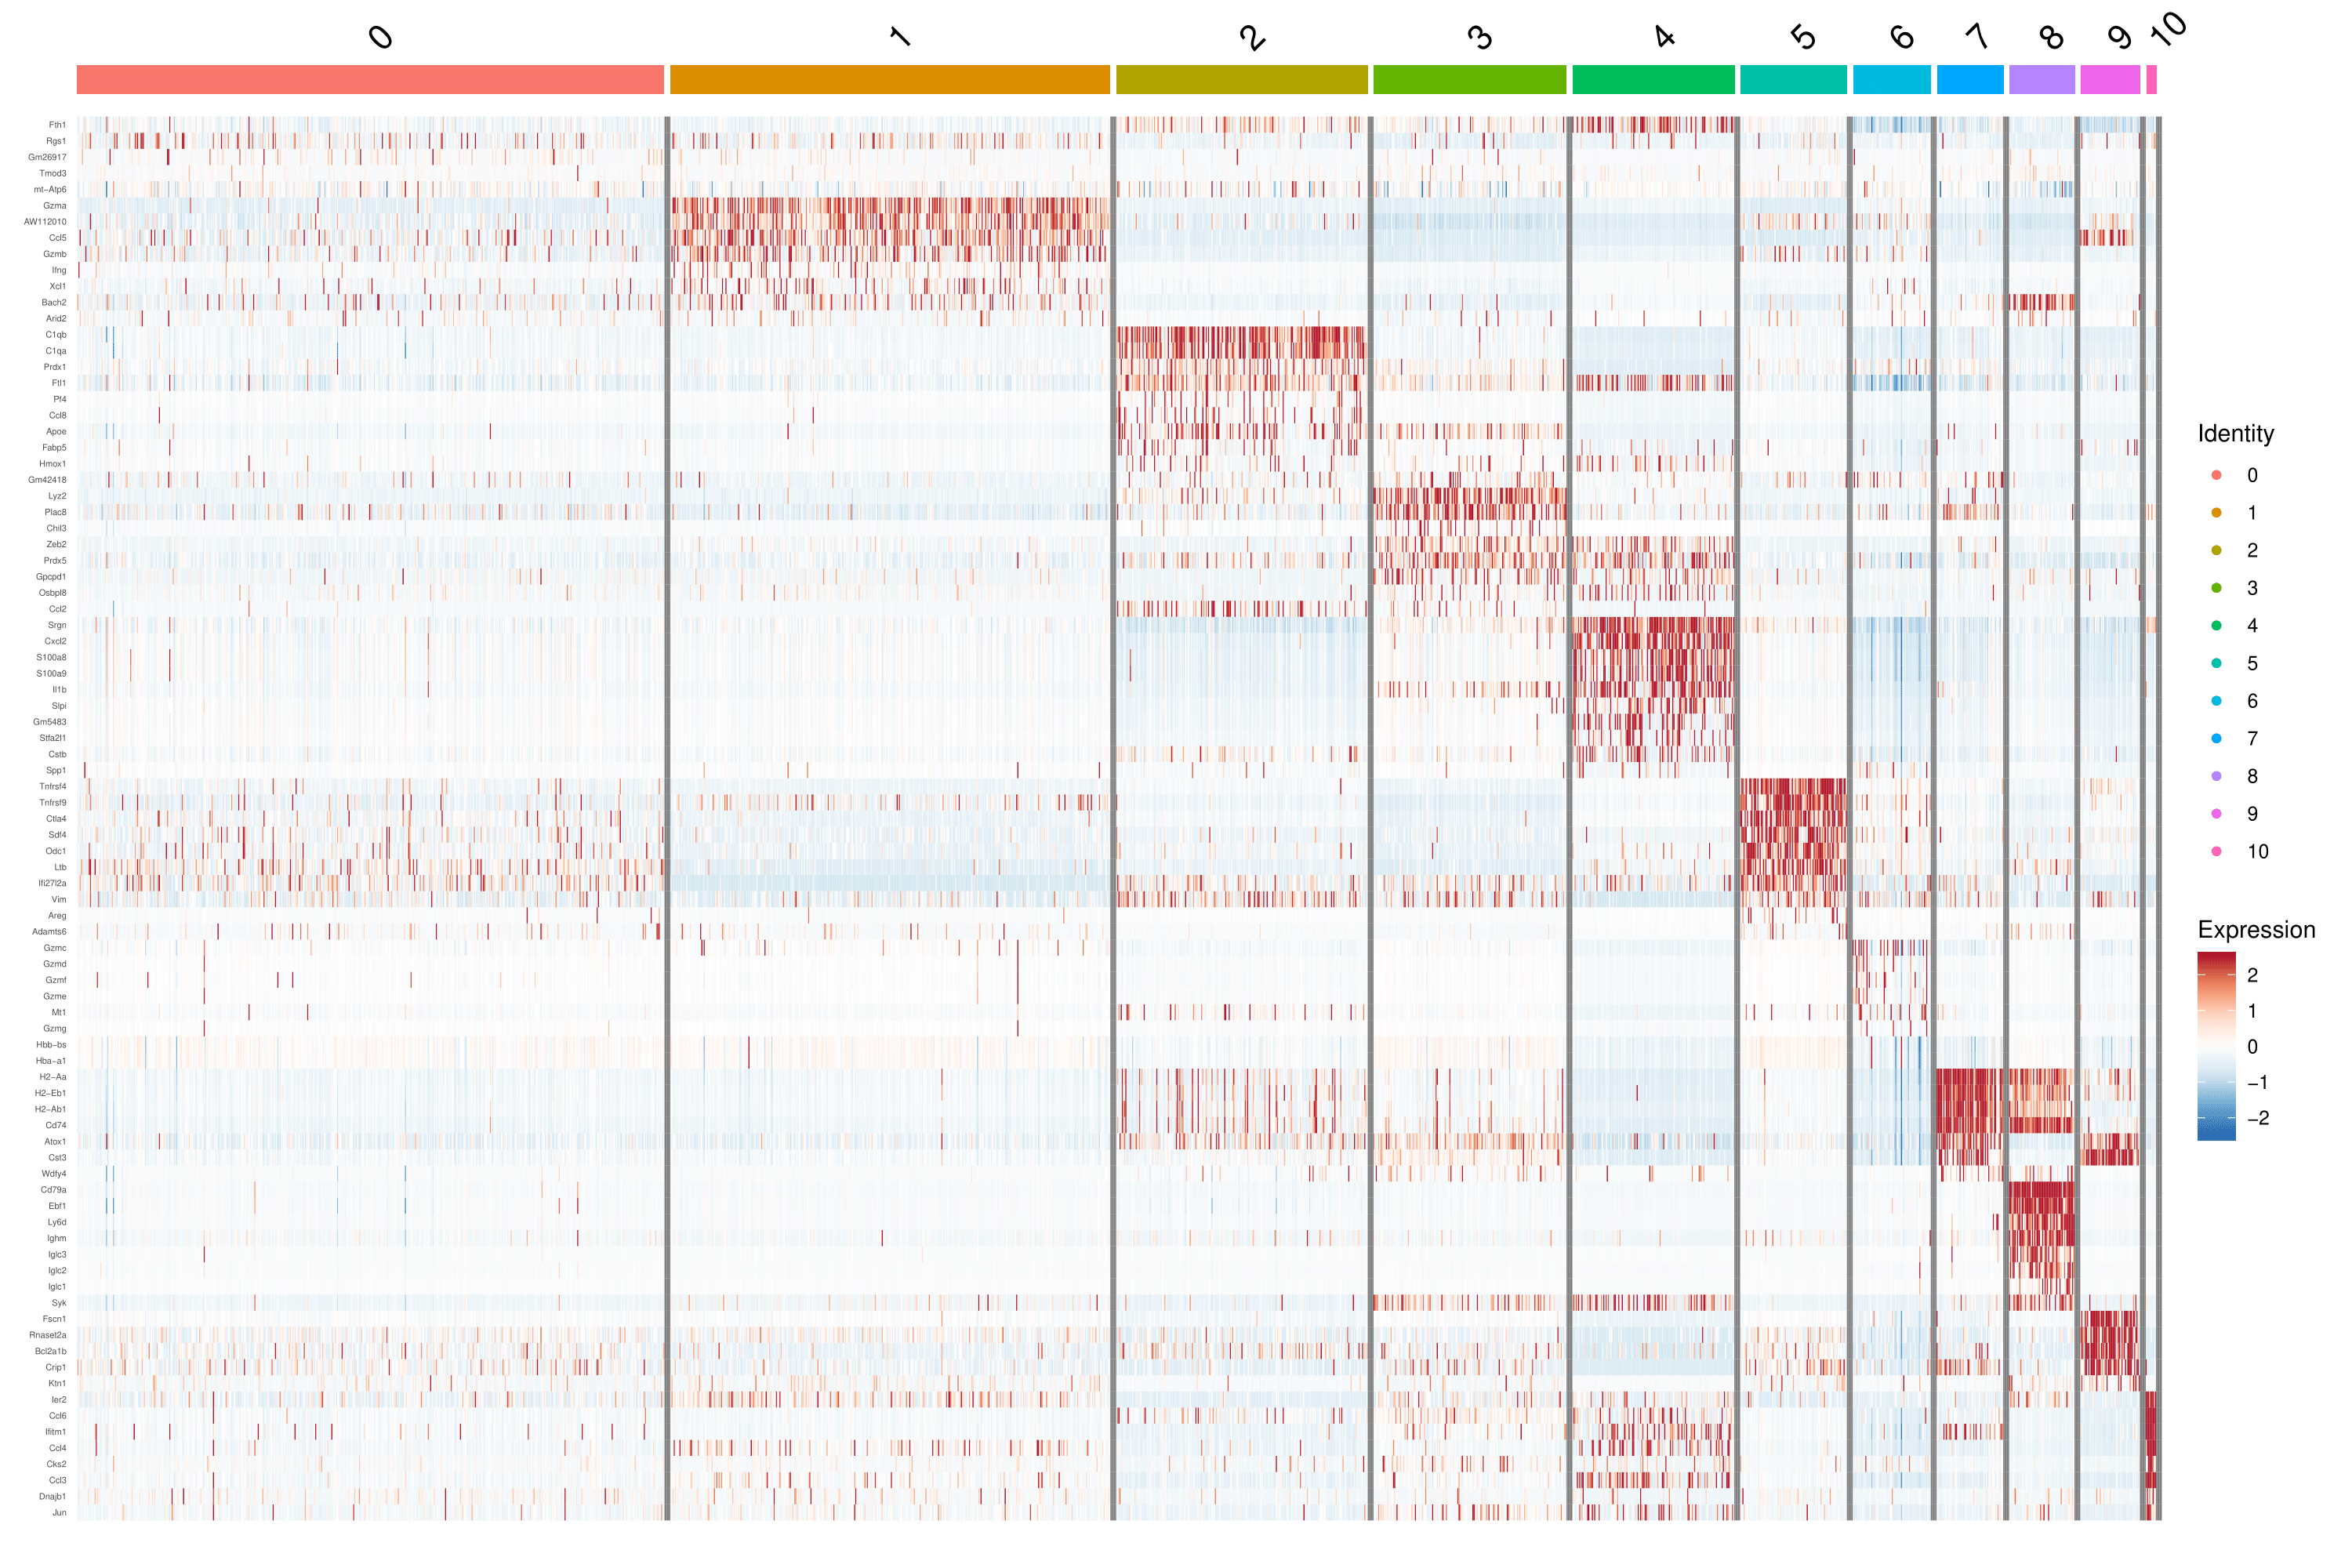
Figure 2 Expression Pattern of Marker Genes
Note: Darker red represents a higher expression level, and darker blue dictates a lower expression level.
Heatmaps show the expression of indicated marker genes for given cells and features. In this case, we plotted the top 10 markers (or all markers if less than 10) for each cluster.
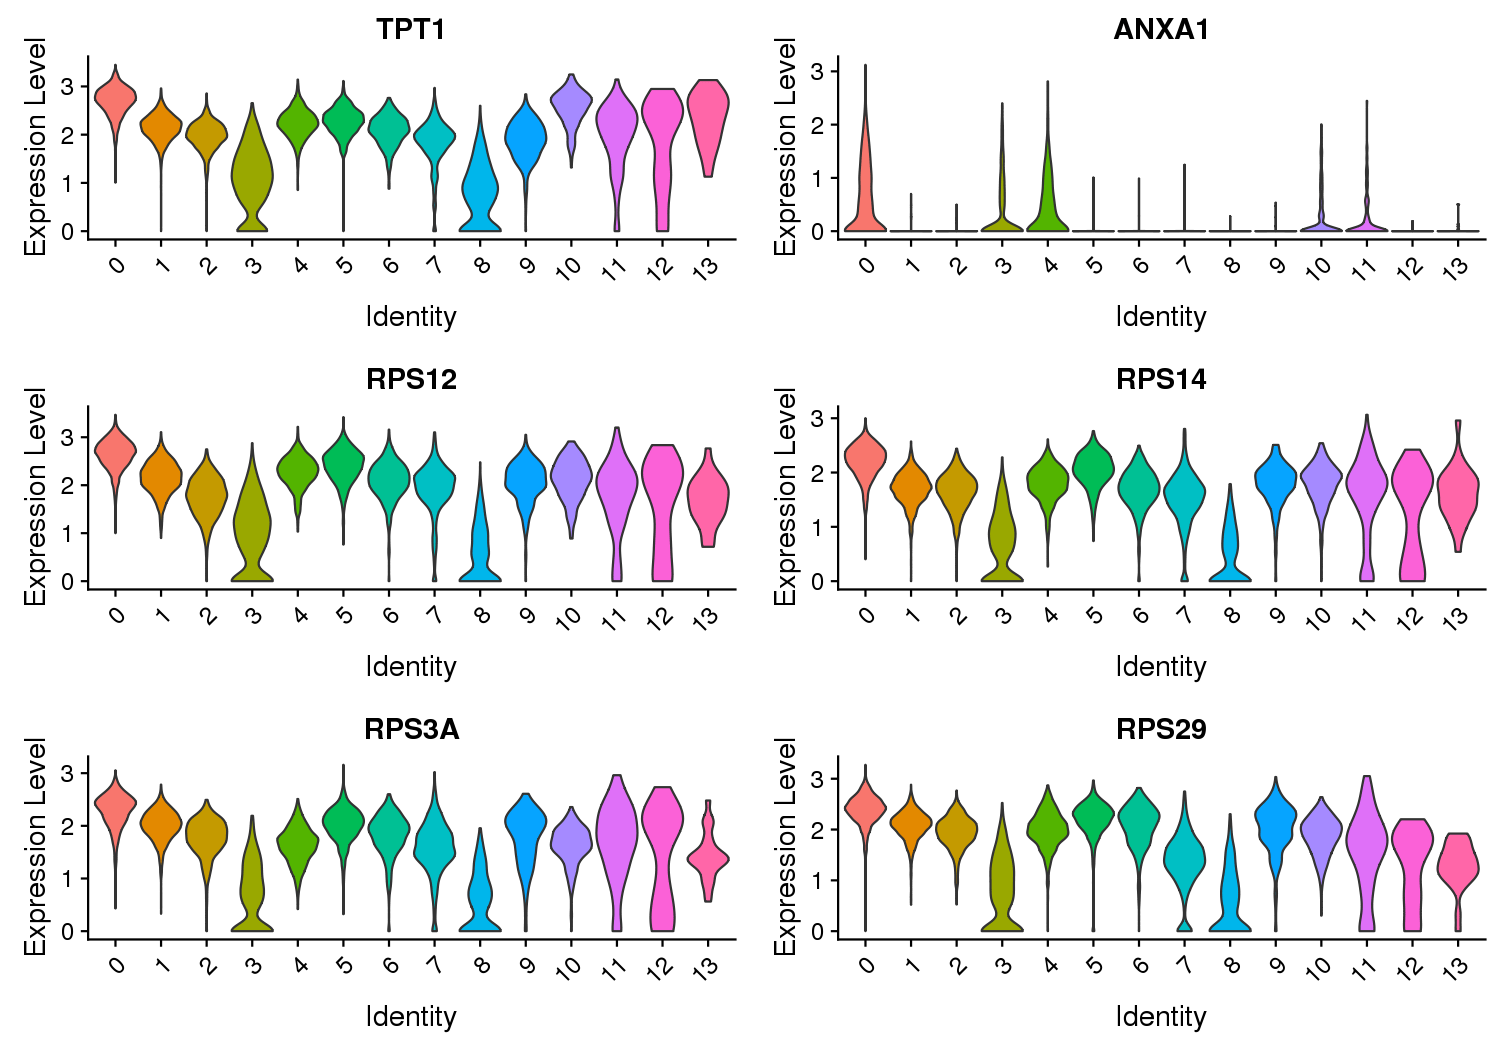
Figure 3 Expression Level of Marker Genes
Note: The X-axis represents the cluster, and the Y-axis represents the expression level.
Violin plots show the relative expression levels of marker genes among all clusters. (Only six marker genes are shown here)