Introduction to Olink Reveal Proteomics
The OlinkTM platform is a multiplex, high-throughput biomarker analysis system based on cutting-edge Proximity Extension Assay (PEA) technology. Novogene seamlessly integrates this PEA technology with Next-Generation Sequencing (NGS) to provide a powerful end-to-end solution for precise, high-throughput protein quantification. This cost-effective and scalable approach delivers exceptional specificity and sensitivity while requiring minimal sample volumes. Ultimately, our solution empowers researchers to achieve profound biological insights, enabling comprehensive proteomic profiling, biomarker discovery, and mechanism elucidation across diverse areas of clinical research.
Certified OlinkTM Service Provider
- We are among the first providers worldwide to offer high-throughput, high-quality protein biomarker discovery services using Olink’s leading proteomics platforms.
- By passing Olink’s concordance test, we have validated that our service quality aligns with Olink’s stringent data delivery criteria.

Key Features of Novogene’s Olink Reveal Service
- OlinkTM Certified Provider: Rely on results you can trust. As a certified provider, we adhere to rigorous quality assurance protocols to guarantee absolute data integrity and consistency.
- Fast Turnaround Time: Accelerate your discoveries with a rapid standard turnaround time of just 3 weeks for sample quantities of 86 (or multiples thereof).
- Proven Expertise: Leverage our extensive project experience navigating complex study designs across a wide variety of sample matrices, including Plasma, Serum, Cerebrospinal Fluid (CSF), BAL fluid, and Cell/Tissue lysates.
- Broad Proteome Coverage: Analyze >1,000 distinct proteins highly relevant to inflammation and immune response, covering 100% of top-level pathways and 64% of all Reactome pathways.
- High Sensitivity & Precision: Achieve remarkable sensitivity as low as fg/ml, with industry-leading reproducibility demonstrated by extremely low variations (Intra-plate CVs at 8.1% and Inter-plate CVs at 4.8%).
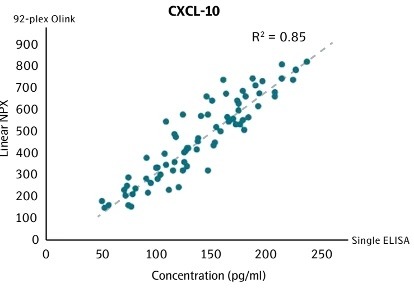
Correlation between conventional ELISA and Olink for CXCL-101
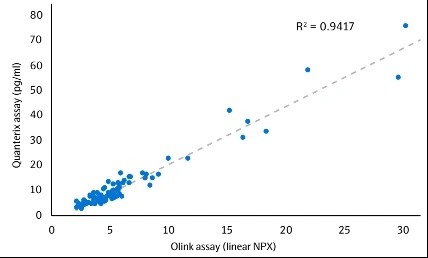
Correlation between Olink and SIMOA for NFL1
Sample Requirements To ensure the highest quality data generation, please adhere to the following sampling guidelines:
| Sample Type | Sample Amount | Storage/Transport Condition | Others |
| Serum/Plasma | 50 μL or more in 1.5 mL tubes | Please include a sufficient amount of dry ice and send by frozen delivery, to avoid sample thawing during shipping. | Store sample at -80℃ immediately after extraction. Hemolysis may affect analysis results. |
| Other Sample Matrix | CSF, lysates, etc.(Please contact us for more information) | ||
*Please contact us for more information.
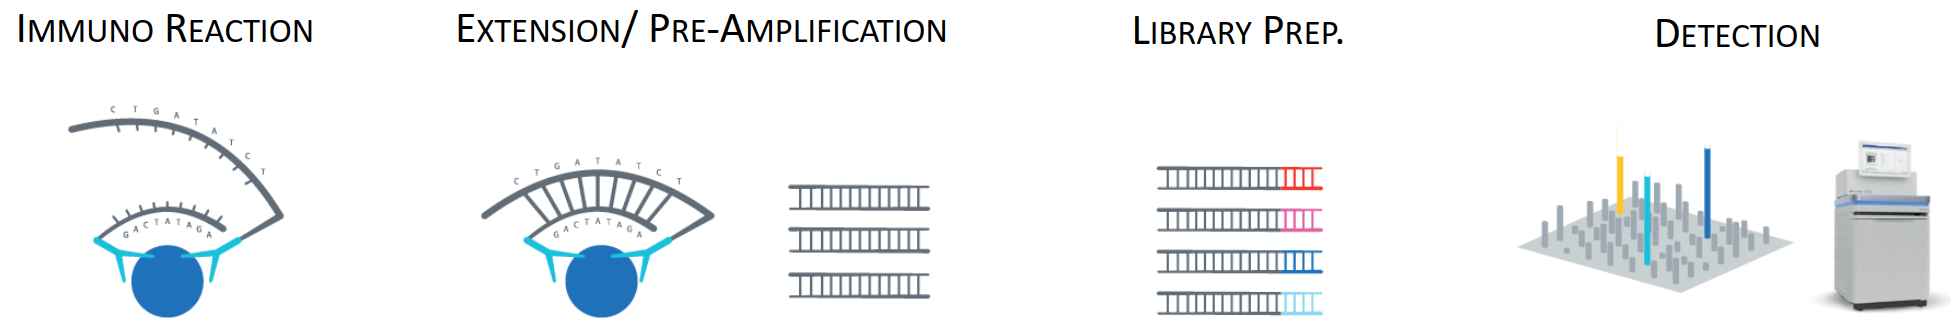
Olink Reveal Workflow
Samples and controls are transferred to a 96-well plate for overnight incubation, during which antibodies bind to their respective target proteins. Oligonucleotides attached to the antibodies come into proximity, hybridize, and are subsequently extended through PCR amplification. Unique sample indexes are introduced to each sample during the amplification step, facilitating pooling into a library. The library is then purified and sequenced.
From sample preparation, library preparation, sequencing and data quality control to bioinformatics analysis, Novogene provides high-quality products and professional services. Each step is performed in agreement with a high scientific standard and meticulous design to ensure high-quality research results.
Gain access to more tools and technical information:
- Access the complete Reveal assay list.
- Sign up for Olink Insight to get access to the pathway browser, study size calculator, and more proteomics tools, and stay connected with a global proteomics community.
Featured publications of Proteomics
Explore top publications:https://olink.com/knowledge/publications
Data Normalization and Quality Control Using NPX Values
NPX, Normalized Protein eXpression, is Olink’s arbitrary unit which is in Log2 scale. Following sequencing, the raw data is converted to counts, assigning an integer value to each assay-sample combination based on the detected copy numbers. These raw data counts are converted into NPX values, enabling the identification of protein level changes within different sample sets, and establishing protein signatures. In general, a higher NPX value refer to a higher protein concentration.
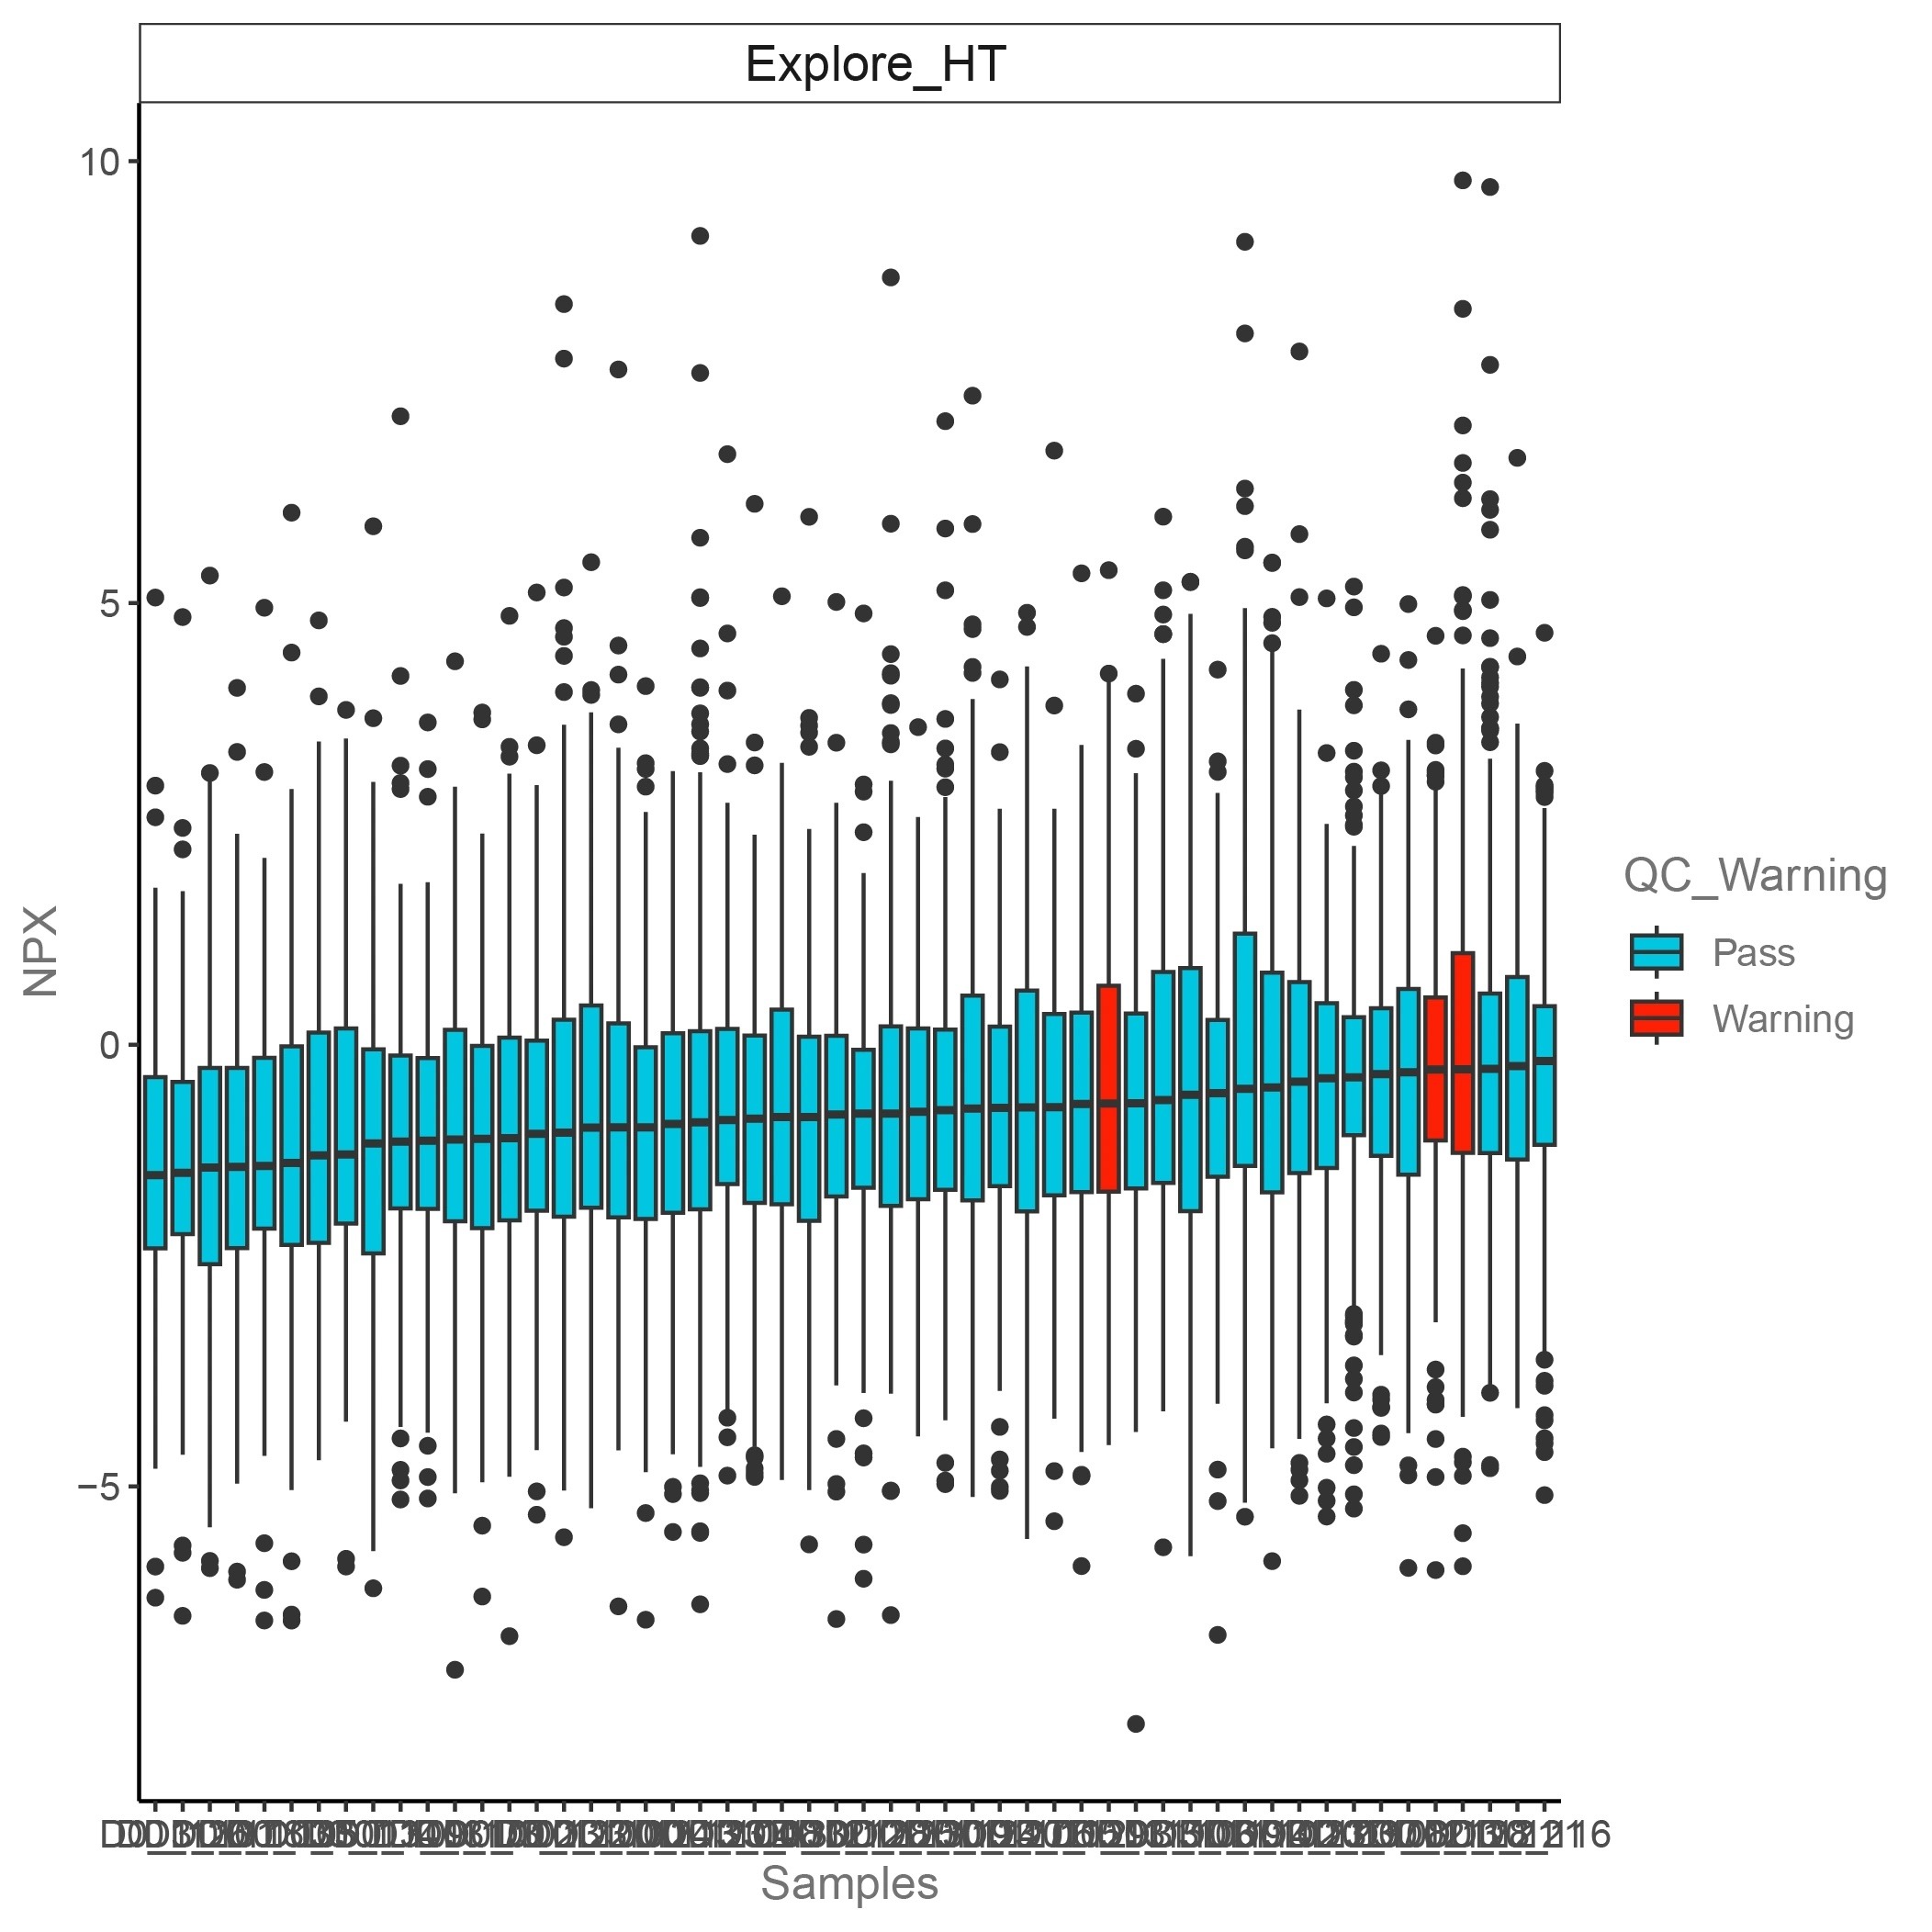
The x-axis represents the sample names. The y-axis represents the NPX values. A red bar indicates a QC warning sample, and a blue bar represents QC pass sample.
Principal Component Analysis of Protein Expression
Principal component analysis (PCA) is a statistical technique for analyzing large dataset by reducing the dimensionality of the dataset. In this analysis, PCA is conducted on the NPX data file, and all samples are plotted as a scatterplot along the selected principal components. It can be useful for showing that samples separate, or cluster based on variables of interest. In addition, it can be used to identify potential outlier samples.
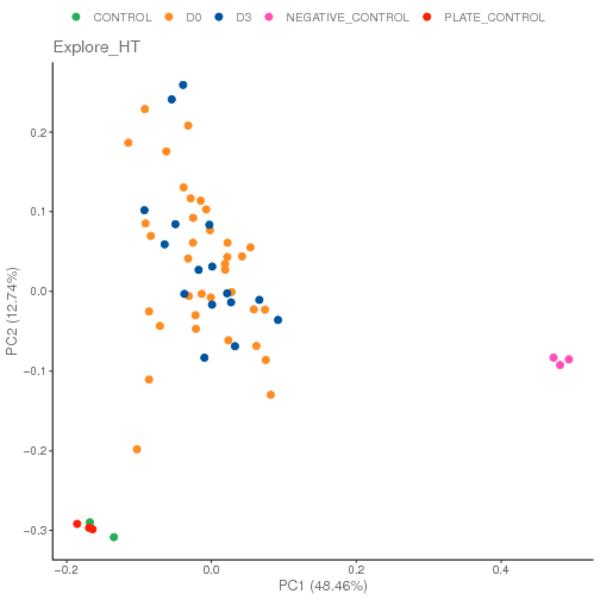
Dots in different colors represent different groups. The closer the distance between samples, the higher the similarity between samples.
Hierarchical Clustering Heatmap of Protein Expression
Hierarchical clustering is a method used to get an overview of data, and to identify subgroups of similar samples or proteins based on protein profiles. This analysis is often visualized through a heatmap, where similar proteins or samples are positioned adjacent to each other. The protein expression levels are then represented using a color gradient on the heatmap.
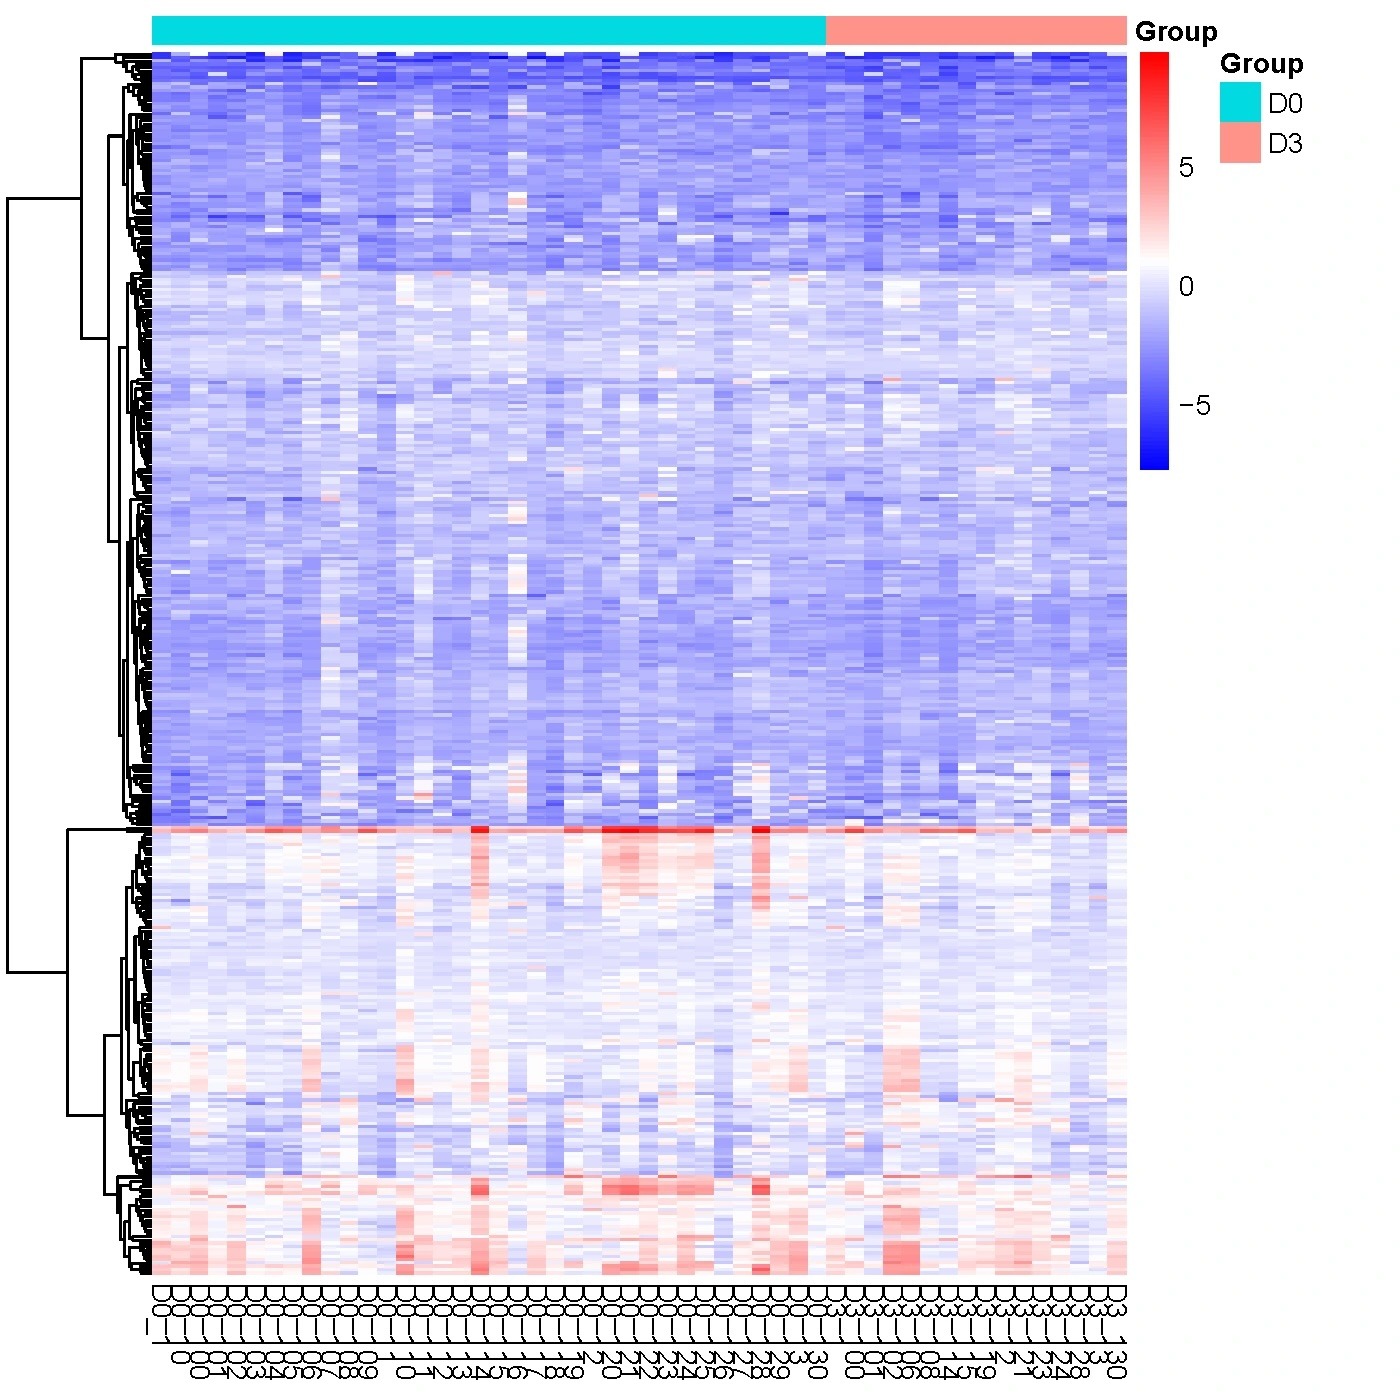
Red color indicates proteins with higher NPX expression levels, and blue color indicates proteins with lower NPX expression levels. The color ranging from red to blue indicates that NPX values range from large to small.
Volcano Plot of Differential Protein Expression
The comparison of protein expression level among groups are performed using t-test or ANOVA and the result is visualized using volcano plot.
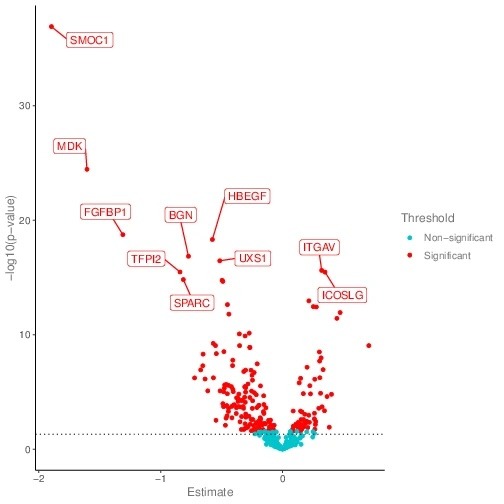
The x-axis shows the NPX.difference between two groups, and the y-axis shows the -log(p-value) value(base 10). NPX.different= NPX.group1 – NPX.group2. Red dots represent significant differential expressed protein. Blue dots represent insignificant differential expressed proteins.
Go Enrichment Analysis
GO is the abbreviation of Gene Ontology (http://www.geneontology.org/), which is a major bioinformatics classification system to unify the presentation of gene properties across all species. It includes three main branches: cellular component, molecular function, and biological process. GO terms with padj < 0.05 are significant enrichment.
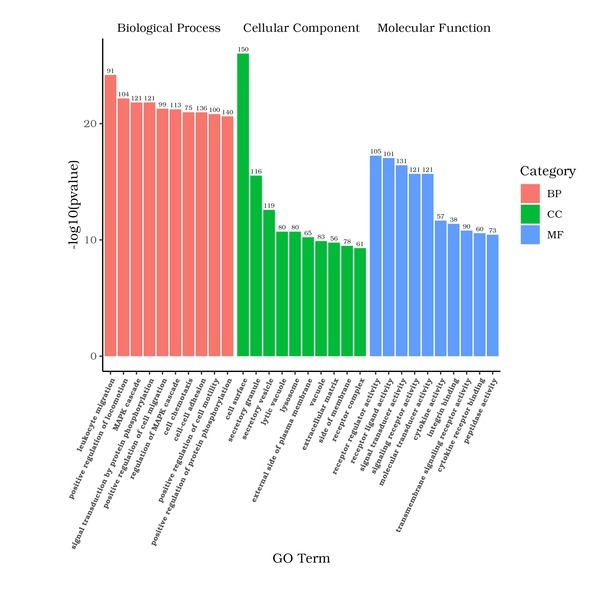
The x-axis represents the GO Term, and the y-axis indicates the level of significance of enrichment for each GO Term, expressed as -log10(padj). Different functional categories are represented by varying colors.
Request a demo report from us today. (Click:Contact Us – Novogene)