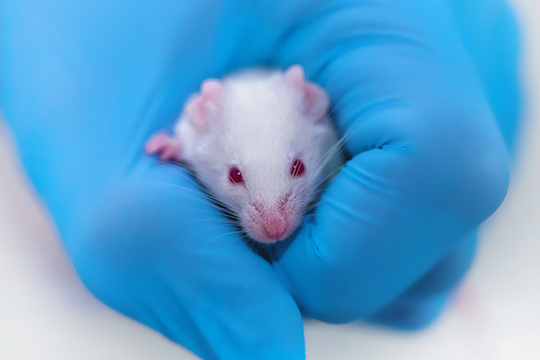
What is Mouse Whole Exome Sequencing?
Mouse Whole Exome Sequencing (mWES), a comparatively cost-effective method than Whole Genome Sequencing (WGS) , aims at targeting exon regions of the mouse genome for the identification of mutations and is particularly beneficial for high-throughput genetic analyses of vast mutant groups. Since the exome only accounts for ~1% of the whole genome [1], mouse whole-exome sequencing enables researchers to attain more in-depth sequencing insights with significantly compact and fewer data, compared with WGS.
Novogene provides end-to-end service processes including DNA extraction, library preparation, sequencing, and analyses for Mouse Whole Exome Sequencing. These services empower researchers to identify causative mutations in mice with distinguishable phenotypes, thus discovering genes associated with human diseases and clarifying drug resistance evolution mechanisms in mouse models.
Applications of Mouse Whole Exome Sequencing
Mouse Whole Exome Sequencing has been helping researchers in elucidating the following mechanisms:
- Drug development in cancer treatment
- Model research on human health and disease
Benefits of Mouse Whole Exome Sequencing
- Agilent SureSelectXT Mouse Exon Kit and NovaSeq 6000 platforms are available for mWES service.
- Data quality with a guarantee of Q30≥85%.
- Average coverage of target region with a percentage of 99.6+/- for mWES.
- Ready-for-publication data and figures bring insights for result overview based on Novogene’s cutting-edge bioinformatics pipeline and database.
mWES Specifications: Sample Requirements
| Sample Type | Amount (Qubit®) | Purity |
| Genomic DNA | ≥ 300 ng | A260/280=1.8-2.0;
no degradation, no contamination |
| Genomic DNA from FFPE tissue | ≥ 400 ng | Fragments should be longer than 1000 bp |
mWES Specifications: Sequencing and Analysis
| Platform | Illumina NovaSeq 6000 | |||||
| Read length | Paired-end 150 bp | |||||
| Sequencing depth | Effective sequencing depth above 50× (6G) | |||||
| Standard data analysis |
|
|||||
Note: For detailed information, please refer to the Service Specifications and contact us for customized requests.
Data Quality Control
Sequencing Error Rate Distribution
The sequencing error rate is the major confounding factor of precise detection of low-frequency variations by deep sequencing. It determines the quality of the sequencing data. The sequencing error rate is highly associated with the sequencing cycle, escalating towards the end of each read because of the consumption of chemical reagents, which is a common feature of the Illumina high throughput sequencing platform.
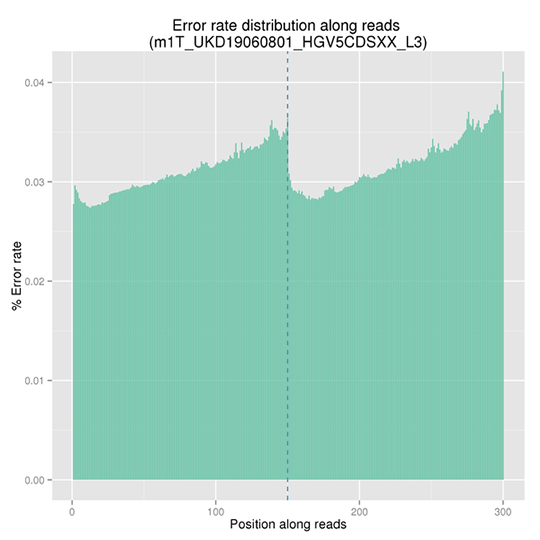
Note: The x-axis represents the position in reads, and the y-axis indicates the average error rate of bases of all reads at a position.
GC Content Distribution
GC content distribution aims to check the potential of AT/GC separation. Sample contamination, sequencing bias, and errors during library preparation can impact on the sequencing results.
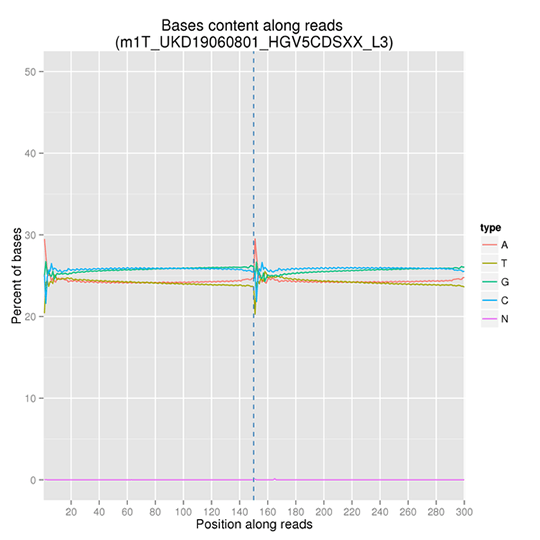
Note: The x-axis represents the position in reads, and the y-axis indicates the percentage of each type of bases (A, T, G, C); different bases can be distinguished by different colors.
Alignment to Reference Genome
Sequencing Depth Distribution
Sequencing depth and coverage illustrate the average number of pair-end clean reads which are aligned to the known reference nucleotides. The sequencing coverage distribution determines whether the identification of variations can be done with a certain degree of confidence at specific base positions.
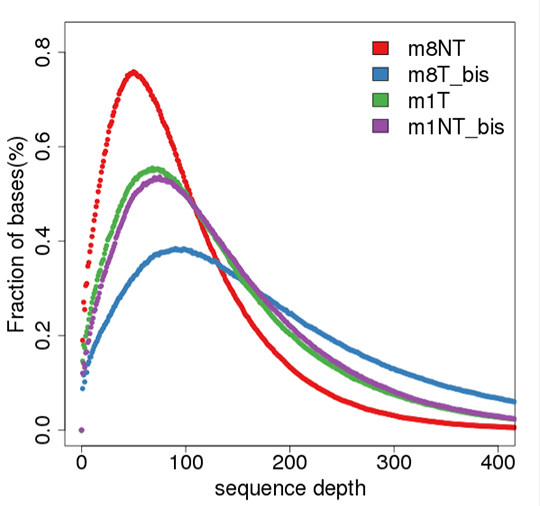
Note:
The figure shows the sequencing depth distribution of all bases in each sample. The x-axis is sequencing depth, and the y-axis is the fraction of bases with the given sequencing depth.
SNP and InDel Calling, Annotation and Statistics
Single nucleotide polymorphisms (SNPs), also known as single nucleotide variants (SNVs), constitute the largest class of genetic variants in the genome. Another class of genetic variations includes small insertions and deletions (InDels) which are <50 bp in length.
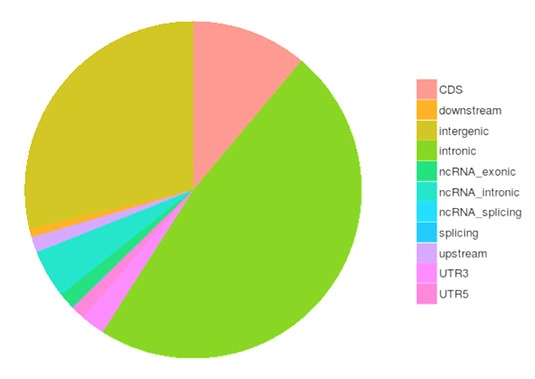
The number of SNPs/lnDelsin various genomic regions
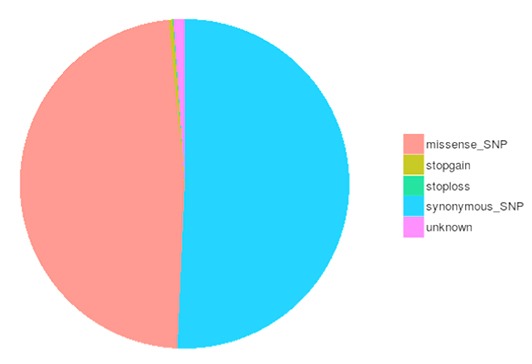
The number of different types of SNPs/InDels in coding region
*Please contact us to get full demo report.
More Research Services

