The Complete Guide to Metatranscriptome Sequencing
It is estimated that humans have more bacteria living in and on our bodies than human cells. Some bacteria play key roles in protection from disease, whereas others, through host interactions, trigger various diseases and disorders. Microbial genome sequencing and Metatranscriptome sequencing are key to discovering the mechanisms by which bacteria prevent or cause disease and distinguishing between virulent (the degree of pathogenicity within a group or species) and avirulent (nonpathogenic) strains of bacteria.
Metatranscriptome sequencing refers to the study of the functional activity of a complete set of transcripts by RNA sequencing, providing insights into the dynamic gene expression patterns in complex microbial communities and shedding light on poorly understood biological systems. By studying the metatranscriptome, researchers can gain a better understanding of the behavior and functions of the microbes in a sample, and how they are responding to their environment.
Key Benefits:
- Provides a comprehensive transcriptome of natural communities without the need for isolating and cultivating microbes.
- Identifies novel genes and detects changes in complex microbial communities at the transcriptional level.
- Conducts functional enrichment analysis of differentially expressed genes.
- Examines adaptive mechanisms.
1. Sample Preparation
Extracting quality RNA from an environmental sample, however, can be a challenge and there are many factors that may be considered. For example, do your samples represent the entire community? Does it matter if you collect the sample during a particular season or time of day? Does the sex of your subject matter?
Metatranscriptome projects require robust rRNA depletion and high data output. rRNA mass is immense, and the number of important RNAs is at relatively low abundance. Deep sequencing is required to examine any given individual and to overcome other predominance of other members in the community.
2. Analysis Pipeline
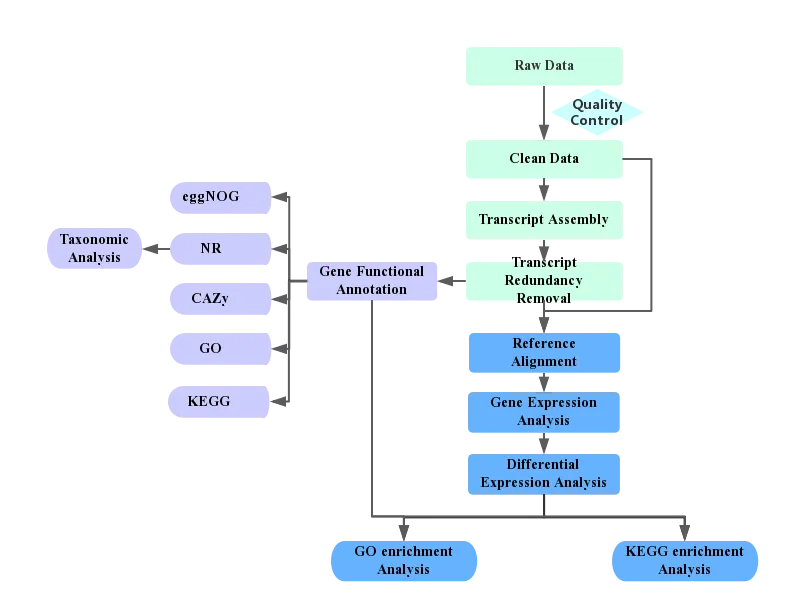
Figure 1. Analysis pipeline
2.1 Transcriptome Reconstruction
To acquire clean reads from pre-processing, SILVA database from NCBI is utilized to map out and isolate rRNA reads from the meta transcriptome. The remaining reads are put together with Trinity software (A professionally transcriptome assembler software comprising modules entitled Inchworm, Chrysalis and Butterfly), followed by integration and redundancy removal with CORSET software. Resultantly, unigene (the longest transcript of a gene) sets are created.
Workflow of Trinity Software:
- Inchworm:Builds a k-mer dictionary (the length sequences of k we get when we use a sliding window of size k to splice a read) utilizing all sequenced reads (k = 25 in practice). It selects the most regularly seeding k-mer in the dictionary and extends the seed in every direction to form a contig group.
- Chrysalis: Groups slightly overlapping the Inchworm contigs into units of joined components, and construct a complete de Bruijn graph for every single component. Each component defines a collection of Inchworm contigs, expected to be derived from alternative splice forms or meticulously related paralogs.
- Butterfly: Recomposes credible, full-length, linear transcripts by harmonizing the individual de Bruijn graphs produced by Chrysalis with the original reads and paired ends. It recomposes discrete transcripts for splice isoforms and paralogous genes and it solves the ambiguities Originating from errors or from sequences >k bases long that are shared between transcripts. Hence, the finally constructed result file is TRINITY.fasta.
2.2 Gene Expression Level Analysis
The calculation of gene expression levels is done by RSEM after analyzing the mapping results of bowtie. This analysis yields the read count for each gene of each sample. Additionally, the read counts are converted into FPKM values. In RNA sequencing, FPKM which is short for the expected number of Fragments Per Kilo base of transcript sequence per Millions base pairs sequenced, is the most common method of assessing gene expression levels, accounting for both sequencing depth and gene length in counting the fragments.
2.3 Gene FPKM density distribution map
The gene expression pattern of each sample as a whole is shown in the FPKM density distribution graph. This graph is not a standard normal distribution graph with a region area of 1, showing a total of 1 chance and a peak of the density distribution curve expressing the highest number of genes at that level as shown in the graph below.
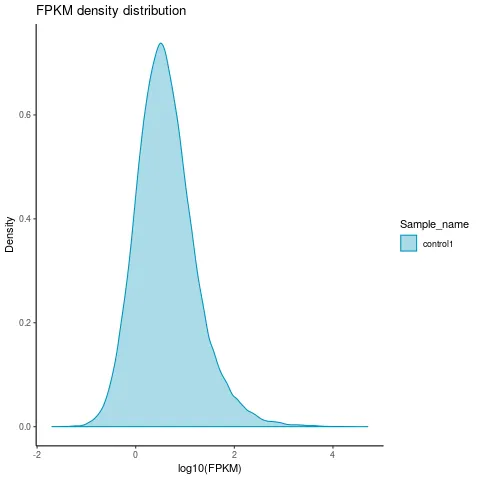
Figure 2. Gene Expression Difference Analysis
The read count value acquired from the gene expression analysis is then utilized as the input data to find out differential expression analysis. The analysis is mainly composed of three parts:
- Normalization: Normalize the read count
- P value Calculation: calculate the hypothesis test probability (p value) according to the model
- Hypothesis Test Corrections: Multiple hypothesis tests are run to correct the hypothesis, which are performed to obtain precise FDR values (error discovery rate).
It is to note that different software will be used to analyze the differential expression of genes depending on different situations.
2.4 Venn diagram of differential expression genes
The Venn diagram represents the number of differentially expressed genes in each set and the overlaps between the sets. The coExpression_venn diagram represents the number of genes that are uniquely expressed within each sample. The overlapping regions show the number of genes that are expressed in two or more samples.
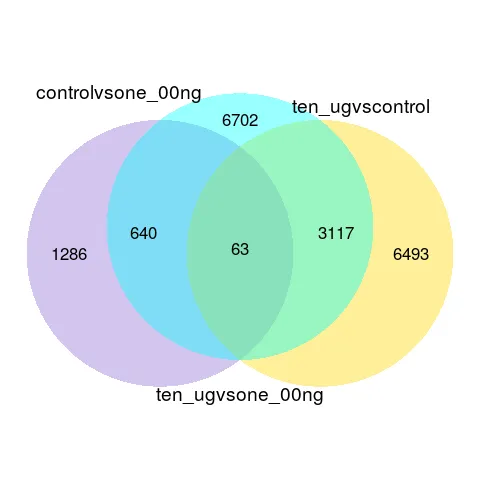
Figure 3. Enrichment Analysis
The enrichment analysis of differentially expressed genes is known as the most substantially related biological function pathways under variety of conditions. At Novogene, we utilize GOseq and KOBAS software (KEGG Orthology Based Annotation System) to conduct GO enrichment analysis and KEGG enrichment analysis. This whole analysis is based on the hypergeometric distribution theory. The differentially expressed gene sets include genes recognized from important analysis. The background gene set contains all genes documented through GO/KEGG enrichment analysis. The enrichment analysis results are acquired by analyzing the differentially expressed gene sets from every comparison group. The displayed image presents the final enrichment analysis results for all comparison groups.
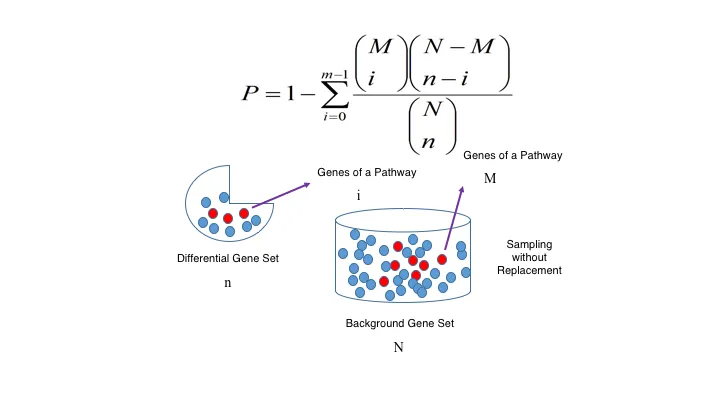
Figure 4. Enrichment Analysis results.
3. Conclusion
The microbiota (wide variety of bacteria) has coevolved with humans to promote nutrition, development, disease resistance, and overall health. Microbiome dysbiosis (imbalance within a community of microorganisms living together) can result from a wide variety of factors, including diet, antimicrobials, host genetics, and failure to transfer to newborns. Whole genome sequencing and metatranscriptome analysis provide the tools needed to study host-microbiome interactions, and understand associated mechanisms of disease, and develop treatments and strategies to restore and maintain health.