Single-Cell Immune Repertoire Sequencing: Resolving TCR/BCR Clonotypes and Functional States at Cellular Resolution

I. Comparison Between Single-Cell TCR Sequencing and Conventional Bulk TCR Sequencing
Bulk TCR sequencing has long served as the standard approach for studying immune repertoire diversity. This method efficiently captures overall clonal composition and CDR3 sequence information, making it particularly advantageous for estimating clonal frequencies and calculating diversity indices. However, as a population-level technique, bulk sequencing cannot link TCR sequences to the functional states of individual cells, limiting its ability to resolve cellular heterogeneity within clonal populations.
Single-cell TCR sequencing overcomes this limitation by integrating antigen receptor sequences with transcriptomic profiles at single-cell resolution. This advancement fundamentally expands the analytical scope from merely characterizing "clonal composition" to elucidating "clonal function," enabling researchers to dissect the functional heterogeneity within clonally related T cells and to trace the differentiation trajectories of individual clones during immune responses1 (Table 1).
Table 1 Analytical capabilities of bulk vs. Single-cell TCR sequencing
| Dimension | Bulk TCR Sequencing | Single-Cell TCR Sequencing |
| Resolution | Population level | Single-cell level |
| Chain pairing | Typically unavailable | Accurate paired αβ chain reconstruction |
| Clonal frequency analysis | ✔ | ✔ |
| Cell type assignment | ✖ | ✔ |
| Functional state analysis | ✖ | ✔ (activation, memory, exhaustion, etc.) |
| Differentiation trajectory integration | ✖ | ✔ |
| Tissue/state transition tracking | Limited | Enabled |
| Primary application | Global diversity assessment | Clonal fate and functional mechanism studies |
II. Structural Basis of TCR/BCR and Immune Repertoire Diversity
TCRs are composed of either paired αβ chains (TRA/TRB) or γδ chains (TRG/TRD), while BCRs consist of paired heavy and light chains. The extraordinary diversity of these receptors arises from V(D)J gene recombination, a process that generates highly variable complementarity-determining region 3 (CDR3) sequences. The CDR3, located at the antigen-binding interface, determines antigen specificity and represents the defining feature for immune repertoire profiling and clonal tracking2 (Figure 1).
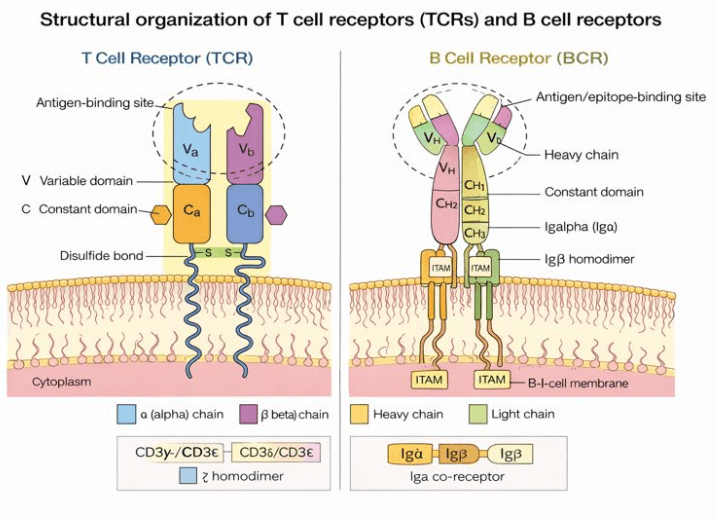
Figure 1 Structural organization of T cell receptors (TCRs) and B cell receptors (BCRs).
III. The 10x Genomics 5’ GEM and V(D)J Single-Cell Immune Profiling Strategy
A widely adopted solution for single-cell immune repertoire analysis is the 10× Genomics 5′ single-cell transcriptome platform. This system employs microfluidic technology to encapsulate individual cells into Gel Bead-in-Emulsion (GEM) droplets, where cellular mRNA is reverse transcribed and tagged with unique cell-specific barcodes. Subsequent targeted enrichment of V(D)J regions enables high-fidelity capture and reconstruction of full-length antigen receptor sequences.
This integrated platform provides three critical capabilities -1) single-cell resolution transcriptome profiling, 2) paired TCR αβ or BCR heavy–light chain reconstruction, and 3) direct linkage between antigen receptor sequences and gene expression profiles.
By unifying clonal identity with functional state information, this approach enables researchers to identify expanded clones within specific cell subsets and to dissect their functional characteristics, differentiation trajectories, and tissue distribution patterns during immune responses.
IV. Technical Performance and Recent Advancements
The 10× Genomics 5′ single-cell immune profiling platform has demonstrated stable and reproducible performance across diverse immune samples. In 2025, optimizations for reagents and microfluidic chips further enhanced workflow sensitivity.
Internal validation by the Novogene R&D team using mouse PBMC and spleen samples showed that the new 5′ V3 chemistry achieved higher median gene detection per cell compared to the previous V2 version, while maintaining robust cell recovery at scales up to 20,000 cells. Key sequencing quality metrics—including reads in cells, sequencing saturation, and RNA read Q30 scores—remain consistently high, ensuring reliable integration of transcriptomic and immune repertoire data (Table 2).
These findings establish that the 10× Genomics 5′ immune profiling system provides a robust framework for clonal expansion analysis, immune cell trajectory mapping, and antigen-specific clonal tracking in single-cell immunology research.
Table 2 Performance Comparison of 10× Genomics 5’ V2 and V3 Chemistries Based on Internal Validation Using Mouse PBMC and Spleen Samples
| Sample | Mouse PBMC sample 1 | Mouse PBMC sample 2 | Mouse spleen sample 1 | Mouse spleen sample 2 | ||||||||
| 10x kit | 5’V2 | 5’V3 | 5’V3 | 5’V2 | 5’V3 | 5’V3 | 5’V2 | 5’V3 | 5’V3 | 5’V2 | 5’V3 | 5’V3 |
| Target cell number | 10000 | 10000 | 20000 | 10000 | 10000 | 20000 | 10000 | 10000 | 20000 | 10000 | 10000 | 20000 |
| Recovered cells | 13,263 | 12,668 | 23,679 | 13,808 | 12,368 | 22,849 | 10,832 | 10,579 | 20,166 | 12,182 | 10,766 | 19,986 |
| Mean reads per cell | 25,770 | 26,984 | 30,530 | 24,460 | 26,533 | 38,727 | 34,500 | 39,369 | 32,768 | 27,073 | 35,001 | 32,722 |
| Median genes per cell | 1,605 | 2,230 | 2,400 | 1,516 | 2,232 | 2,635 | 1,486 | 2,658 | 2,532 | 1,650 | 2,558 | 2,425 |
| Fraction of reads in cells | 96.70% | 90.00% | 91.90% | 97.30% | 90.40% | 91.60% | 94.90% | 86.60% | 86.60% | 94.10% | 85.00% | 88.90% |
| Sequencing Saturation | 74.50% | 50.10% | 52.40% | 73.10% | 47.60% | 53.60% | 83.70% | 55.00% | 47.90% | 76.40% | 51.30% | 55.10% |
| RNA Read Q30 | 97.50% | 97.30% | 97.40% | 97.60% | 97.30% | 96.80% | 97.70% | 97.30% | 96.60% | 97.60% | 97.40% | 97.00% |
V. General Analytical Framework for Single-Cell TCR Data
Single-cell TCR data are typically analyzed in conjunction with transcriptomic profiles generated from the same GEM-based 5′ workflow, enabling direct integration of immune receptor sequences with gene expression states at single-cell resolution. The analytical framework encompasses four key dimensions3,4:
1. Receptor Sequence Analysis
Characterization of V(D)J gene usage, CDR3 sequence features, clonotype definition, and clonal frequency estimation.
2. Clonal Expansion and Diversity Analysis
Assessment of clone size distribution, diversity indices (e.g., Shannon entropy, clonality), and clonal overlap across samples or experimental conditions.
3. Integration of Clonotypes with Cellular Phenotypes
Because transcriptome and TCR information originate from the same cells, expanded clones can be mapped to transcriptionally defined T cell subsets (e.g., naïve, effector, memory, exhausted) to identify subset-specific clonal enrichment patterns.
4. Clonotype-Resolved Trajectory and Functional Analysis
Through integration with pseudotime analysis, RNA velocity, or pathway enrichment methods, clonotype-associated cells can be positioned along differentiation trajectories to dissect clonal fate decisions and functional state transitions.
References
- Chen, L., Wang, Y., Zhang, R., & Li, M. (2024). Advances and challenges in investigating B-cells via single-cell transcriptomics. Nature Methods, 21(7), 889–898.
- Schroeder HW Jr, Cavacini L. Structure and function of immunoglobulins. J Allergy Clin Immunol. 2010 Feb;125(2 Suppl 2):S41-52. doi: 10.1016/j.jaci.2009.09.046. PMID: 20176268; PMCID: PMC3670108.
- Yang, Q, & Safina, K., Nguyen, K., Tuong, Z.K., & Borcherding, N. (2025). “scRepertoire 2: Enhanced and efficient toolkit for single-cell immune profiling.” PLoS Computational Biology https://doi.org/10.1371/journal.pcbi.1012760
- Borcherding, Nicholas, Nicholas L. Bormann, and Gloria Kraus. “scRepertoire: An R-based toolkit for single-cell immune receptor analysis.” F1000Research https://doi.org/10.12688/f1000research.22139.2
Why Choose Novogene for Single-cell RNA Sequencing (single-cell RNA-Seq or scRNA-Seq)?
Proven Expertise: With over 200,000 successfully sequenced samples, Novogene delivers great project results at industry-leading turnaround times. We excel at handling challenging sample types, including nerve and adipose cells.
Enhanced Sample Processing: We offer a diverse range of sample processing capabilities, including nuclei extraction and specialized pipelines for frozen tissues. This ensures high-quality gene expression data in Single-cell RNA Sequencing (single-cell RNA-Seq or scRNA-Seq) projects.
Certified Excellence: As a 10x Genomics Certified Service Provider, we leverage the advanced Chromium X platform combined with GEM-X technology for superior reproducibility and efficiency.
Cost-Effective Solutions: We have state-of-the-art high-throughput sequencing platforms, coupled with expert support, which ensure exceptional data quality and provide cost-effective solutions for single-cell projects.