Blog


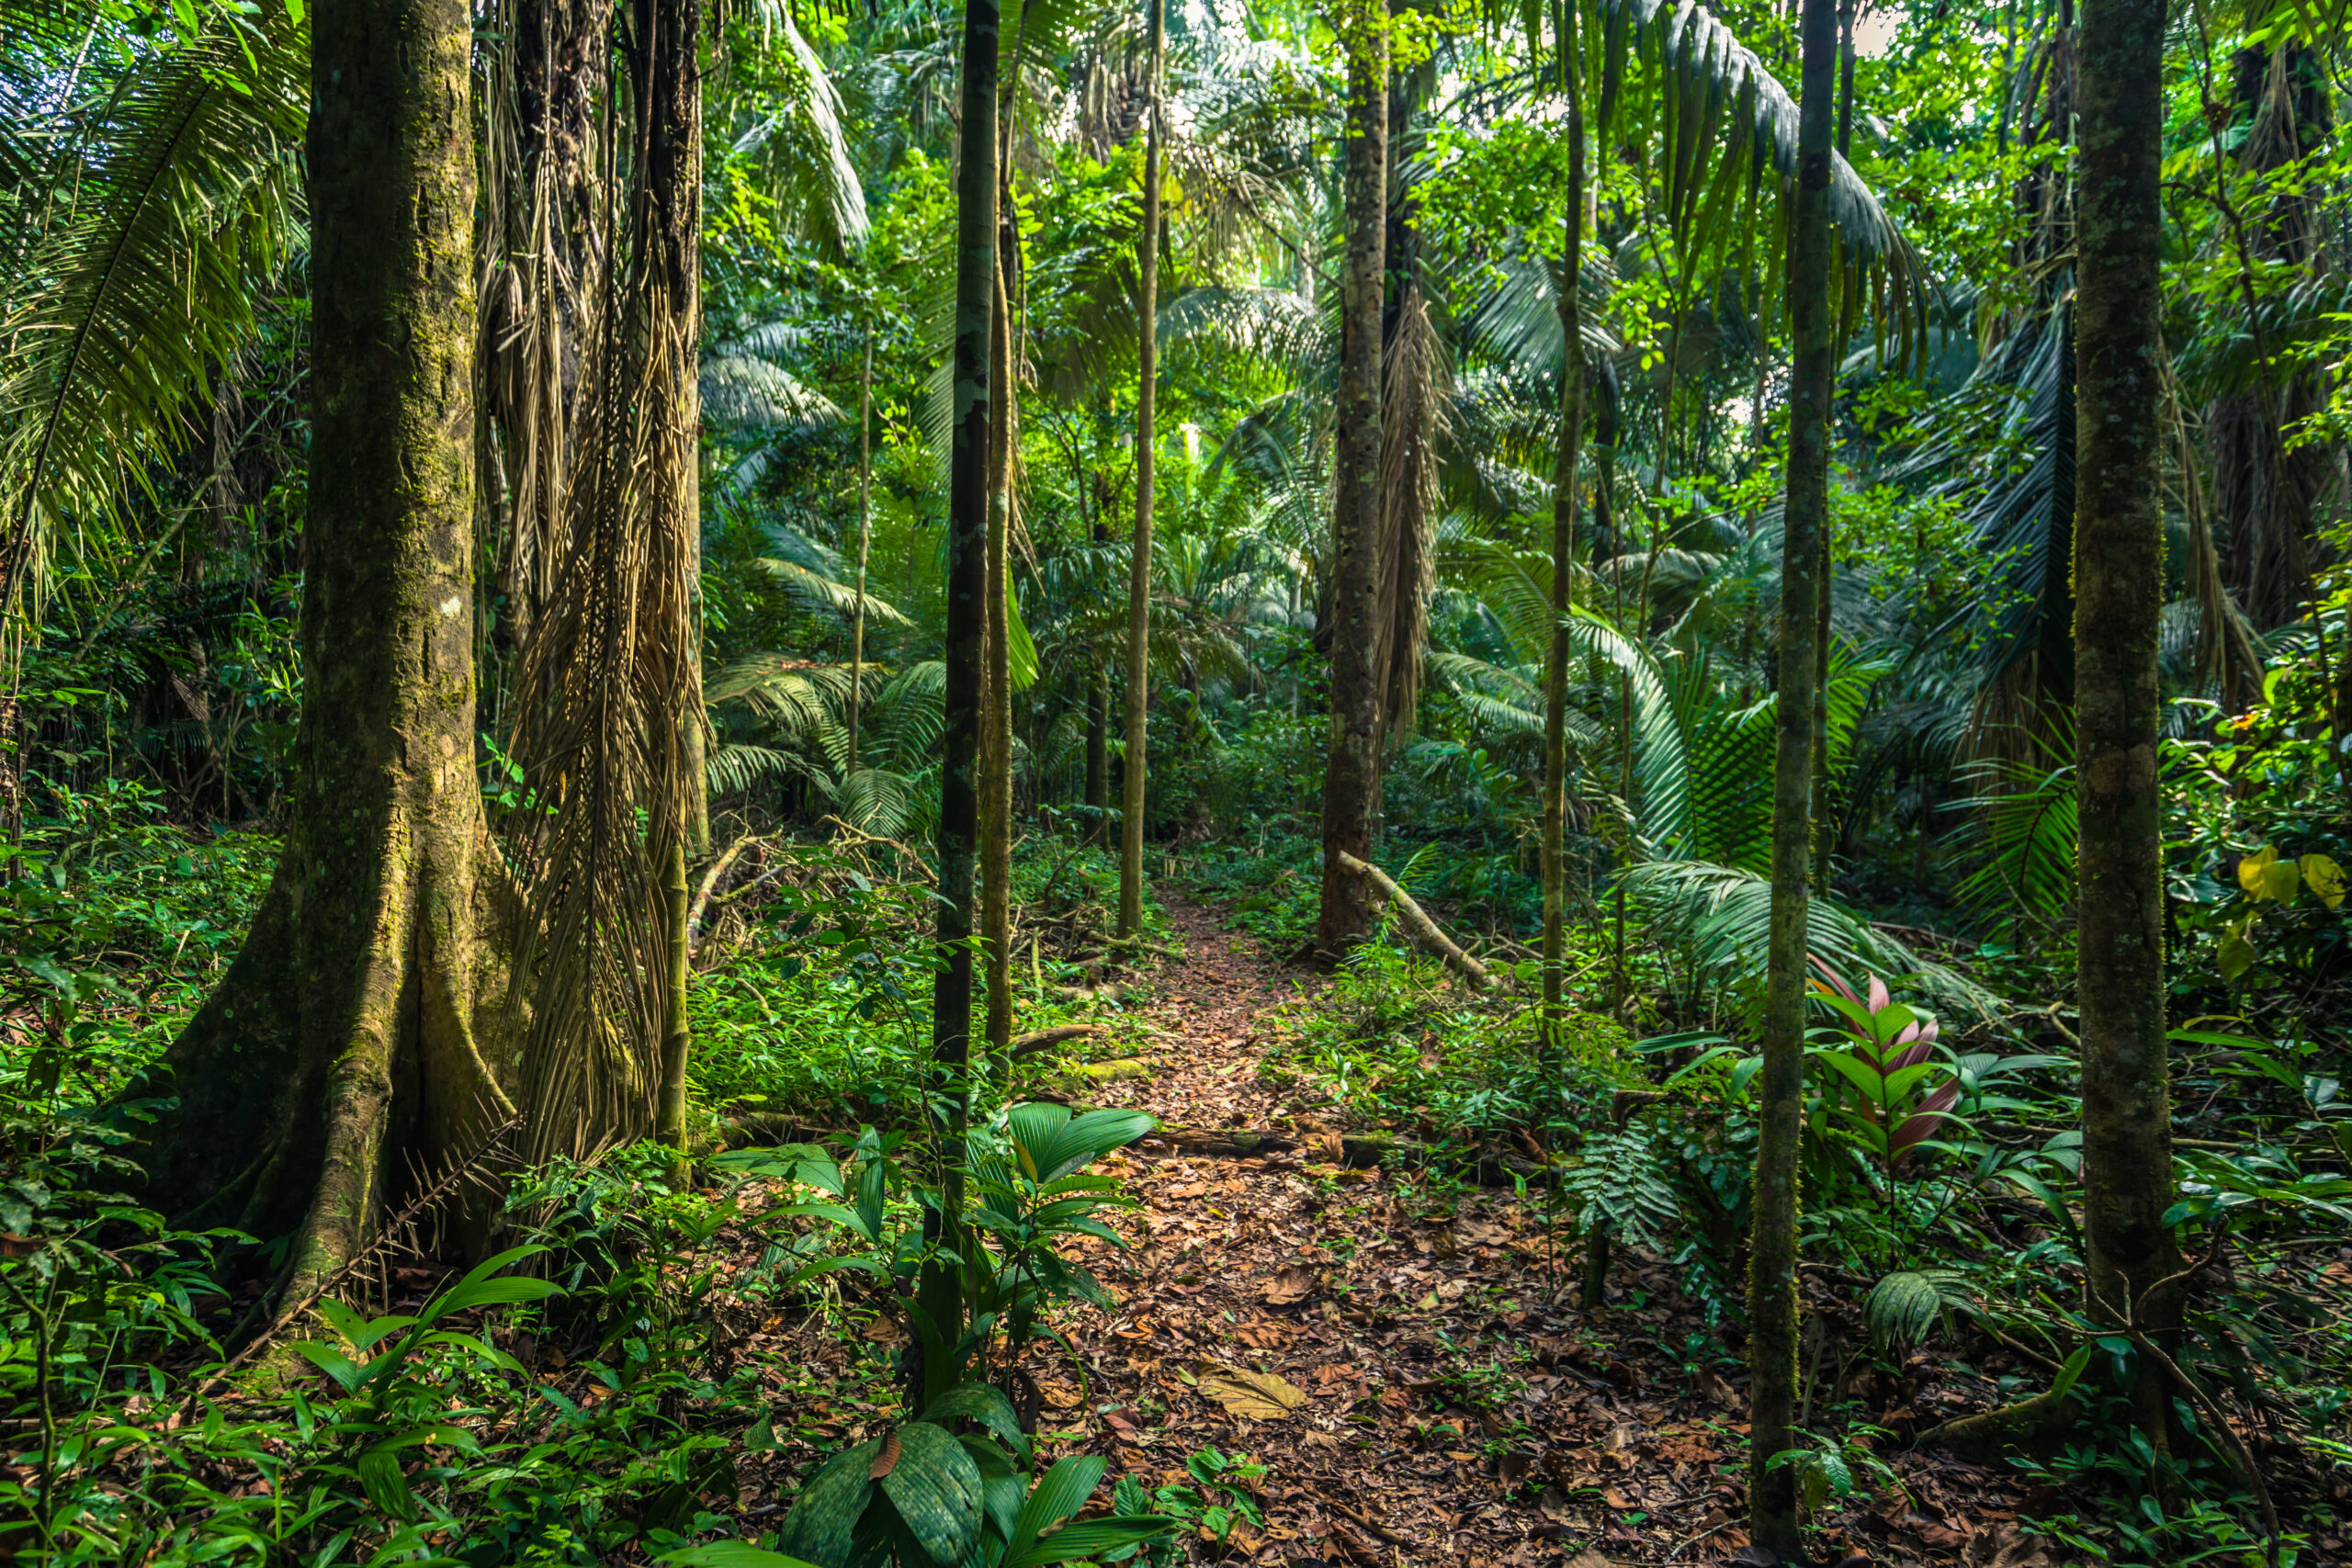

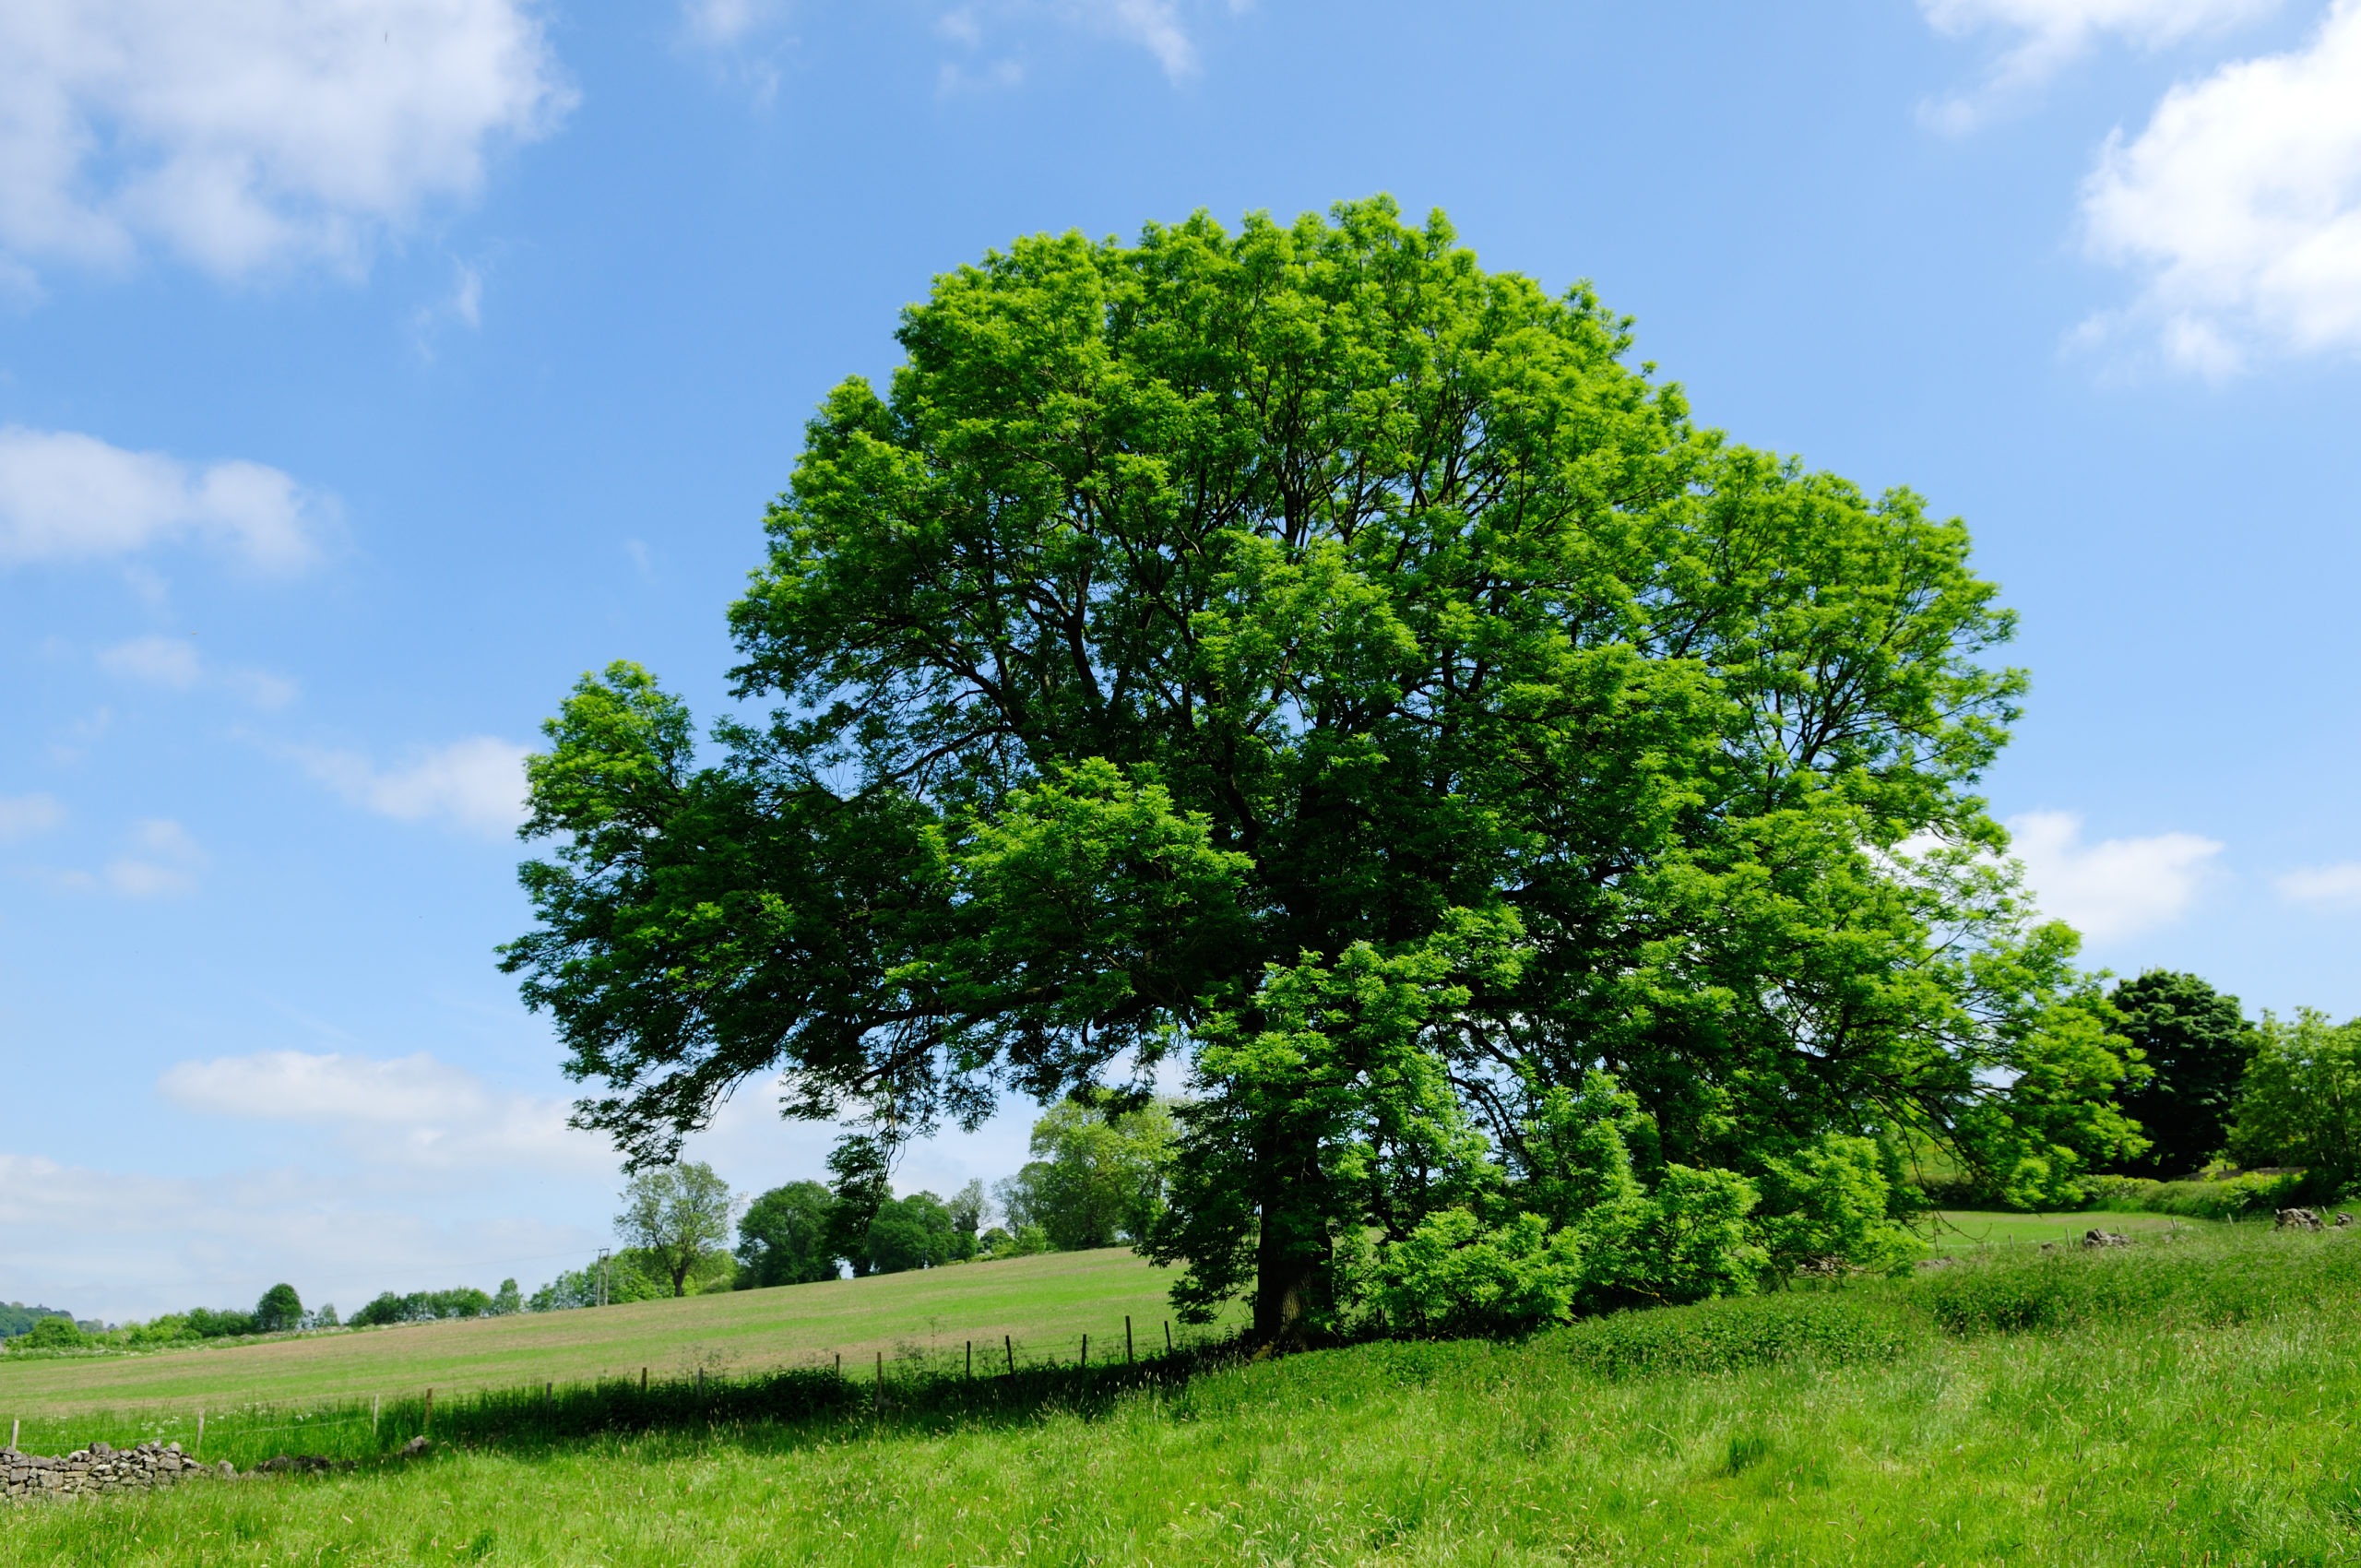
Darwin Tree of Life Project
- 21/07/2022
- Sequencing
- Genomes
- Ecosystem


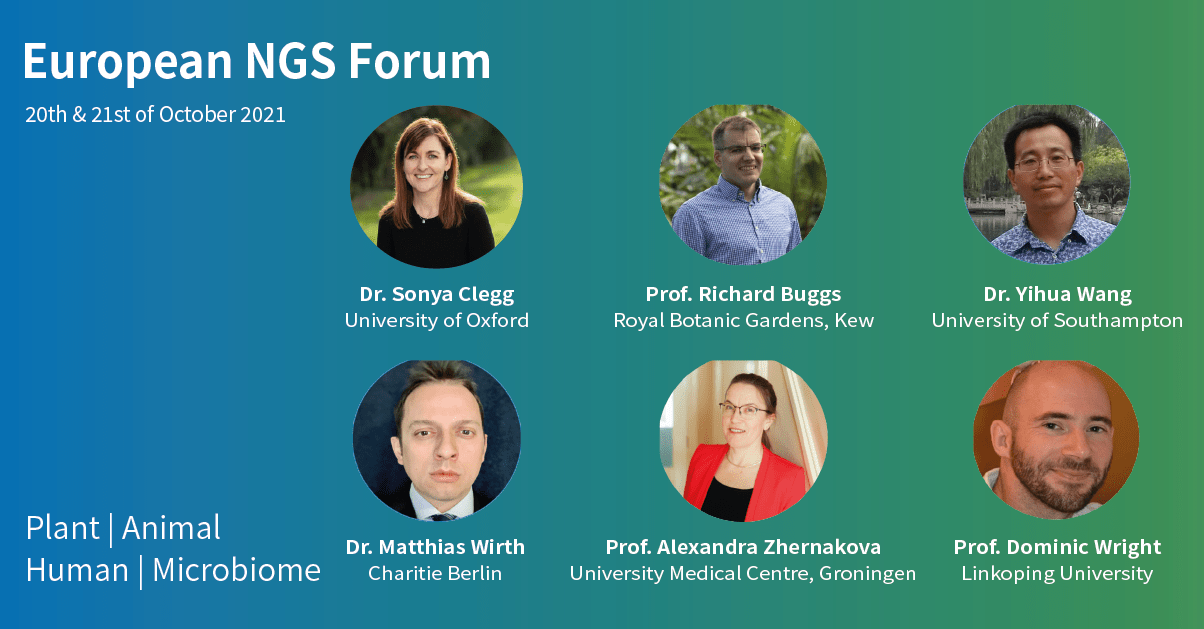
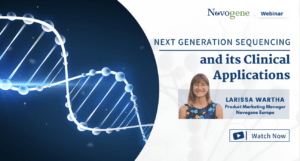
A look back on Novogene’s 2021 NGS Forum
- 26/11/2021
- NGS
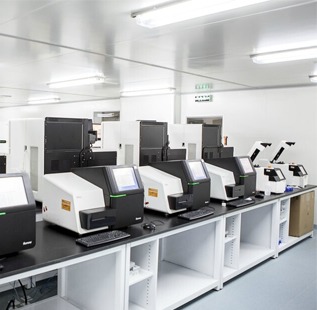
Running a lab in the time of COVID-19.
- 14/10/2021
- COVID-19

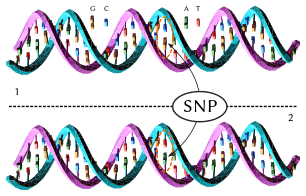
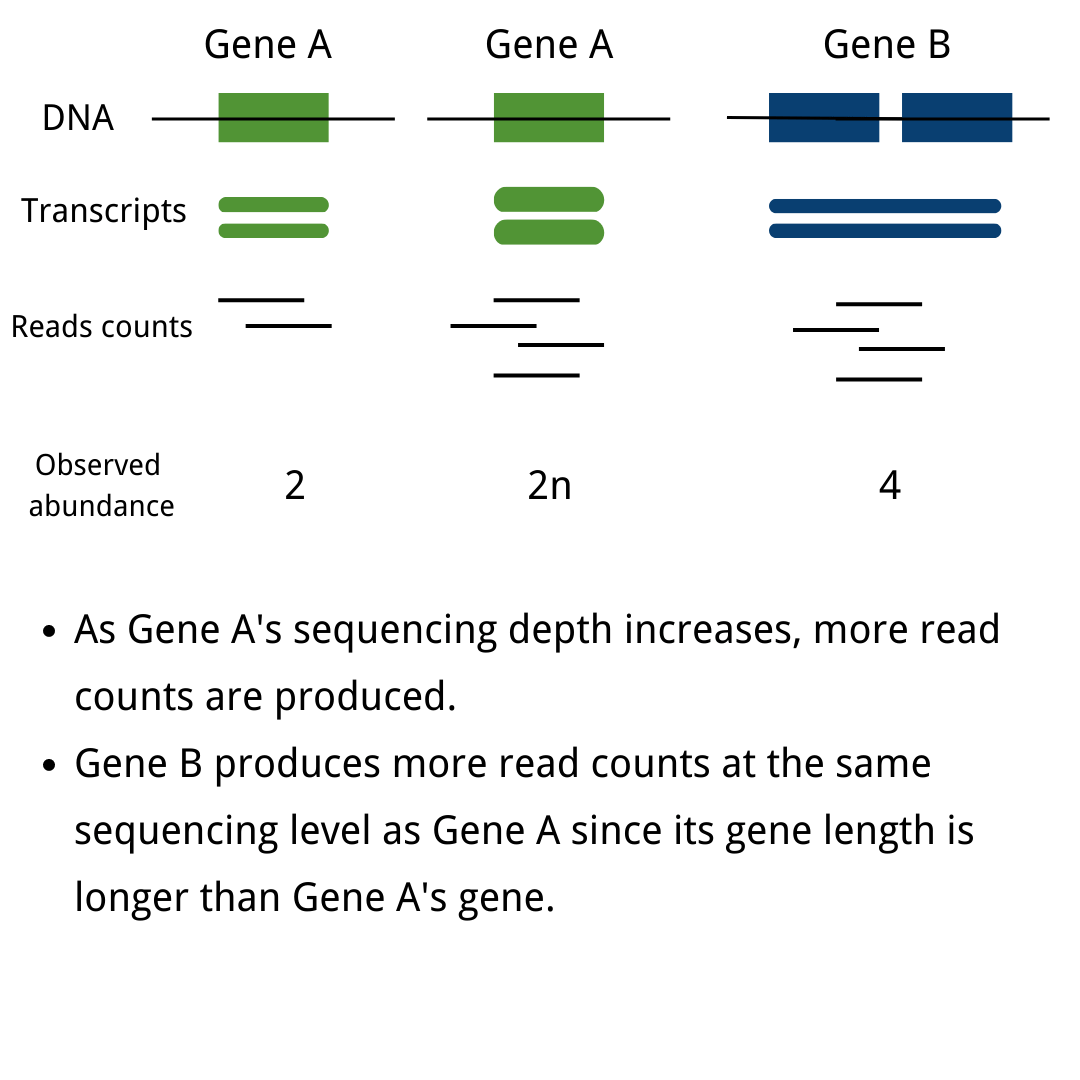
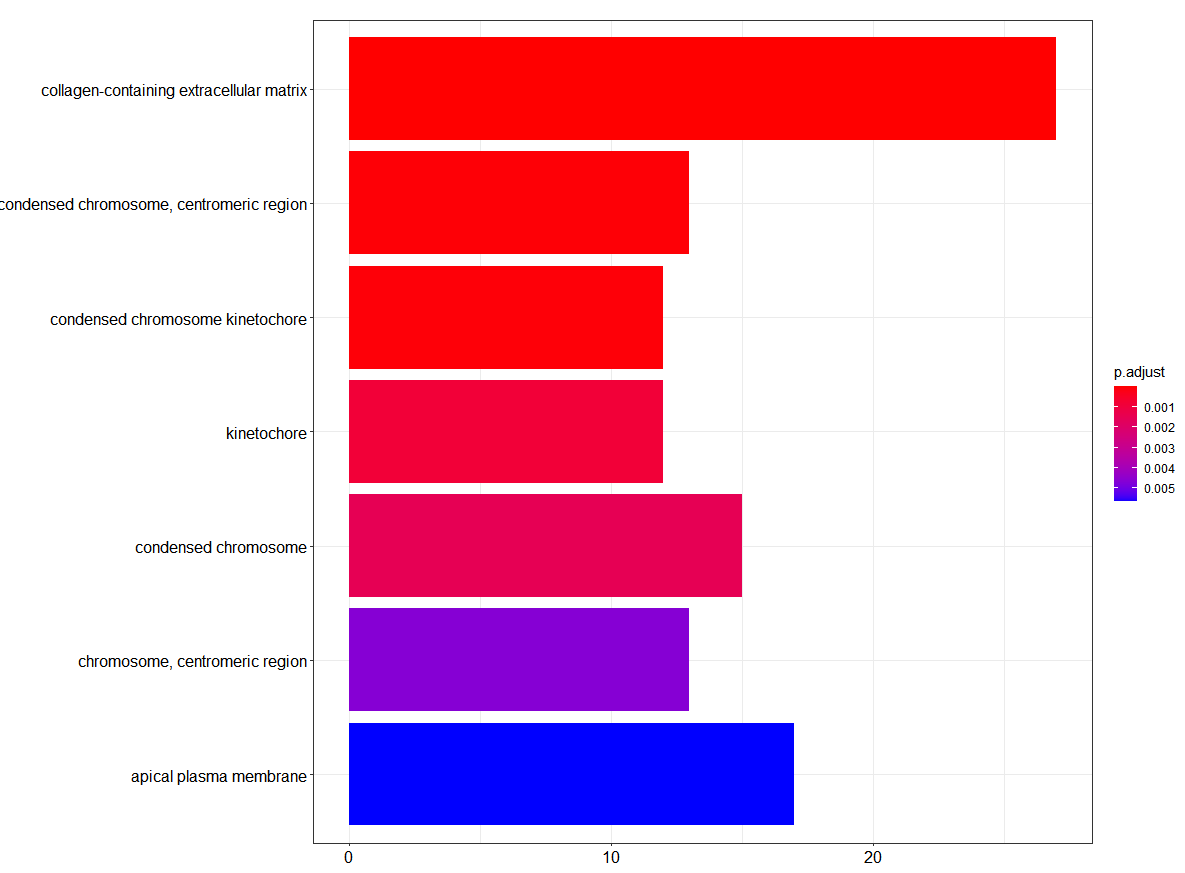
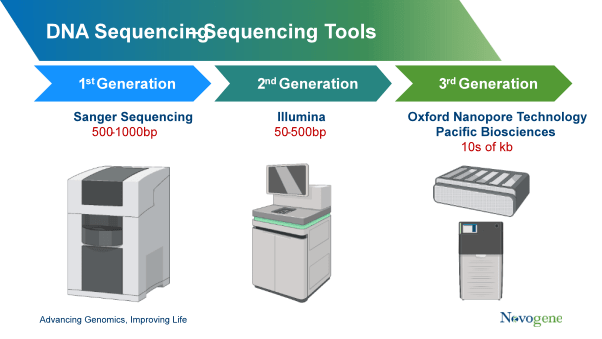
A basic guide to RNA-sequencing
- 28/04/2021
- RNA-seq
- RNA sequencing


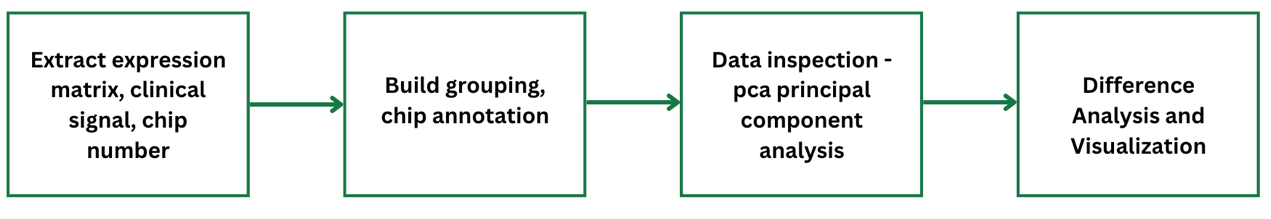
Hello R World! - Introduction to R
- 12/12/2020
- bioinformatics
- R