Reaching Maximum 465Gb/lane, with an Average Q30 >95%, Novogene’s NovaSeq X Plus Data at a Glance!
NovaSeq™ X Plus is Illumina’s latest high-throughput sequencing system that delivers exceptional performance in terms of throughput, production capacity and sustainability. With a throughput of up to 2.5 times greater than previous sequencers, it can generate more than 20,000 whole genomes annually and provide an ideal choice for large-scale sequencing projects and ambitious genomics studies. Validation run with PhiX library and human whole genome sequencing are completed. The results are available now! Let us discover the extraordinary capabilities of the cutting-edge solutions. Try a NovaSeq X Plus lane with Novogene!
1. Quality Control Overview of Validation Testing with PhiX Library
The average data output and Q30 are 443Gb/lane and >95%, respectively. One lane highly reached 465Gb.
| Lane No. | PF (%) | Reads PF (M) | Q30 (%) | Yield (GB) | Error Rate (%) |
| 1 | 75.26 ± 8.35 | 1,468.08 | 95.17 | 217.05 | 0.51 ± 0.4 |
| 2 | 78.59 ± 3.17 | 1,533.02 | 95.49 | 227.59 | 0.33 ± 0.3 |
| 3 | 76.73 ± 4.69 | 1,496.74 | 95.25 | 221.74 | 0.55 ± 0.57 |
| 4 | 75.88 ± 11.66 | 1,480.03 | 95.67 | 218.62 | 0.51 ± 0.58 |
| 5 | 77.85 ± 12.49 | 1,518.43 | 96.17 | 223.85 | 0.45 ± 0.35 |
| 6 | 80.67 ± 4.64 | 1,573.52 | 96.31 | 232.69 | 0.38 ± 0.28 |
| 7 | 75.64 ± 13.11 | 1,475.48 | 95.71 | 218.13 | 0.44 ± 0.33 |
| 8 | 73.38 ± 12.55 | 1,431.29 | 95.66 | 211.12 | 0.43 ± 0.3 |
| Lane No. | PF (%) | Reads PF (M) | Q30 (%) | Yield (GB) | Error Rate (%) |
| 1 | 75.26 ± 8.35 | 1,468.08 | 94.95 | 217.13 | 0.42 ± 0.38 |
| 2 | 78.59 ± 3.17 | 1,533.02 | 95.1 | 227.22 | 0.38 ± 0.31 |
| 3 | 76.73 ± 4.69 | 1,496.74 | 95.21 | 221.8 | 0.47 ± 0.35 |
| 4 | 75.88 ± 11.66 | 1,480.03 | 95.44 | 218.53 | 0.46 ± 0.41 |
| 5 | 77.85 ± 12.49 | 1,518.43 | 95.57 | 223.84 | 0.53 ± 0.38 |
| 6 | 80.67 ± 4.64 | 1,573.52 | 95.68 | 232.51 | 0.45 ± 0.4 |
| 7 | 75.64 ± 13.11 | 1,475.48 | 95.33 | 218.17 | 0.48 ± 0.42 |
| 8 | 73.38 ± 12.55 | 1,431.29 | 95.07 | 210.96 | 0.51 ± 0.4 |
2. Testing Result of Human Whole Genome Sequencing
Using sample NA12878 for library preparation, performing whole-genome sequencing simultaneously on the NovaSeq X Plus and NovaSeq 6000 to further evaluate the platform performance.
2.1 Quality Control
Compared with the NovaSeq 6000, the Novaseq X Plus platform performs better in Q30 (94.63% in average).
| Sample | Effective (%) | Error (%) | Q20 (%) | Q30 (%) | GC (%) | Containing N (%) | Low quality (%) | Adapter related (%) |
| NA12878_NovaSeq X Plus_1 | 99.83 | 0.03 | 96.91 | 94.45 | 41.72 | 0.01 | 0.00 | 0.16 |
| NA12878_NovaSeq X Plus_2 | 99.88 | 0.03 | 96.81 | 94.67 | 41.14 | 0.00 | 0.00 | 0.12 |
| NA12878_NovaSeq X Plus_3 | 99.87 | 0.03 | 96.77 | 94.41 | 41.3 | 0.00 | 0.00 | 0.13 |
| NA12878_NovaSeq X Plus_4 | 99.82 | 0.03 | 97.31 | 94.97 | 41.73 | 0.01 | 0.00 | 0.17 |
| NA12878_NovaSeq 6000 | 99.83 | 0.03 | 97.60 | 93.34 | 42.08 | 0.00 | 0.00 | 0.17 |
2.2 Mapping Statistics
The Novaseq X Plus and NovaSeq 6000 platforms achieve even coverage across the entire genome with coverage of ~99% under an average sequencing depth of 30x.
| Sample | Mapped (%) | Properly (%) | PE mapped (%) | Average Sequencing Depth (%) | Coverage (%) | 4X (%) | 10X (%) | 20X (%) |
| NA12878_NovaSeq X Plus_1 | 99.75 | 97.06 | 99.70 | 29.99 | 98.99 | 98.64 | 97.84 | 88.41 |
| NA12878_NovaSeq X Plus_2 | 99.74 | 97.09 | 99.69 | 30.01 | 98.99 | 98.64 | 97.81 | 88.92 |
| NA12878_NovaSeq X Plus_3 | 99.71 | 97.02 | 99.66 | 29.96 | 98.99 | 98.64 | 97.83 | 88.86 |
| NA12878_NovaSeq X Plus_4 | 99.71 | 97.04 | 99.67 | 29.96 | 98.99 | 98.63 | 97.83 | 88.52 |
| NA12878_NovaSeq 6000 | 99.89 | 96.90 | 99.83 | 28.84 | 98.63 | 98.63 | 97.77 | 85.19 |
2.3 Variant Calling Accuracy
The NovaSeq X Plus and NovaSeq 6000 have >95% similarity in SNP detection. The SNP and InDel precision and recall deviation between the two platforms is <0.2%.
| Sample | Precision (SNP) (%) | Recall (SNP) (%) | F-score (SNP) (%) | Precision (InDel) (%) | Recall (InDel) (%) | F-score (InDel) (%) | dbSNP (SNP) (%) | dbSNP (InDel) (%) |
| NA12878_NovaSeq X Plus_1 | 99.18 | 97.94 | 98.55 | 88.09 | 85.92 | 86.99 | 96.55 | 88.34 |
| NA12878_NovaSeq X Plus_2 | 99.14 | 97.84 | 98.48 | 87.93 | 85.95 | 86.93 | 96.55 | 88.50 |
| NA12878_NovaSeq X Plus_3 | 99.14 | 97.86 | 98.50 | 87.98 | 86.09 | 87.02 | 96.57 | 88.46 |
| NA12878_NovaSeq X Plus_4 | 99.16 | 97.98 | 98.57 | 88.07 | 86.18 | 87.12 | 96.51 | 88.30 |
| NA12878_NovaSeq 6000 | 99.36 | 98.01 | 98.68 | 88.59 | 86.04 | 87.30 | 96.66 | 88.41 |
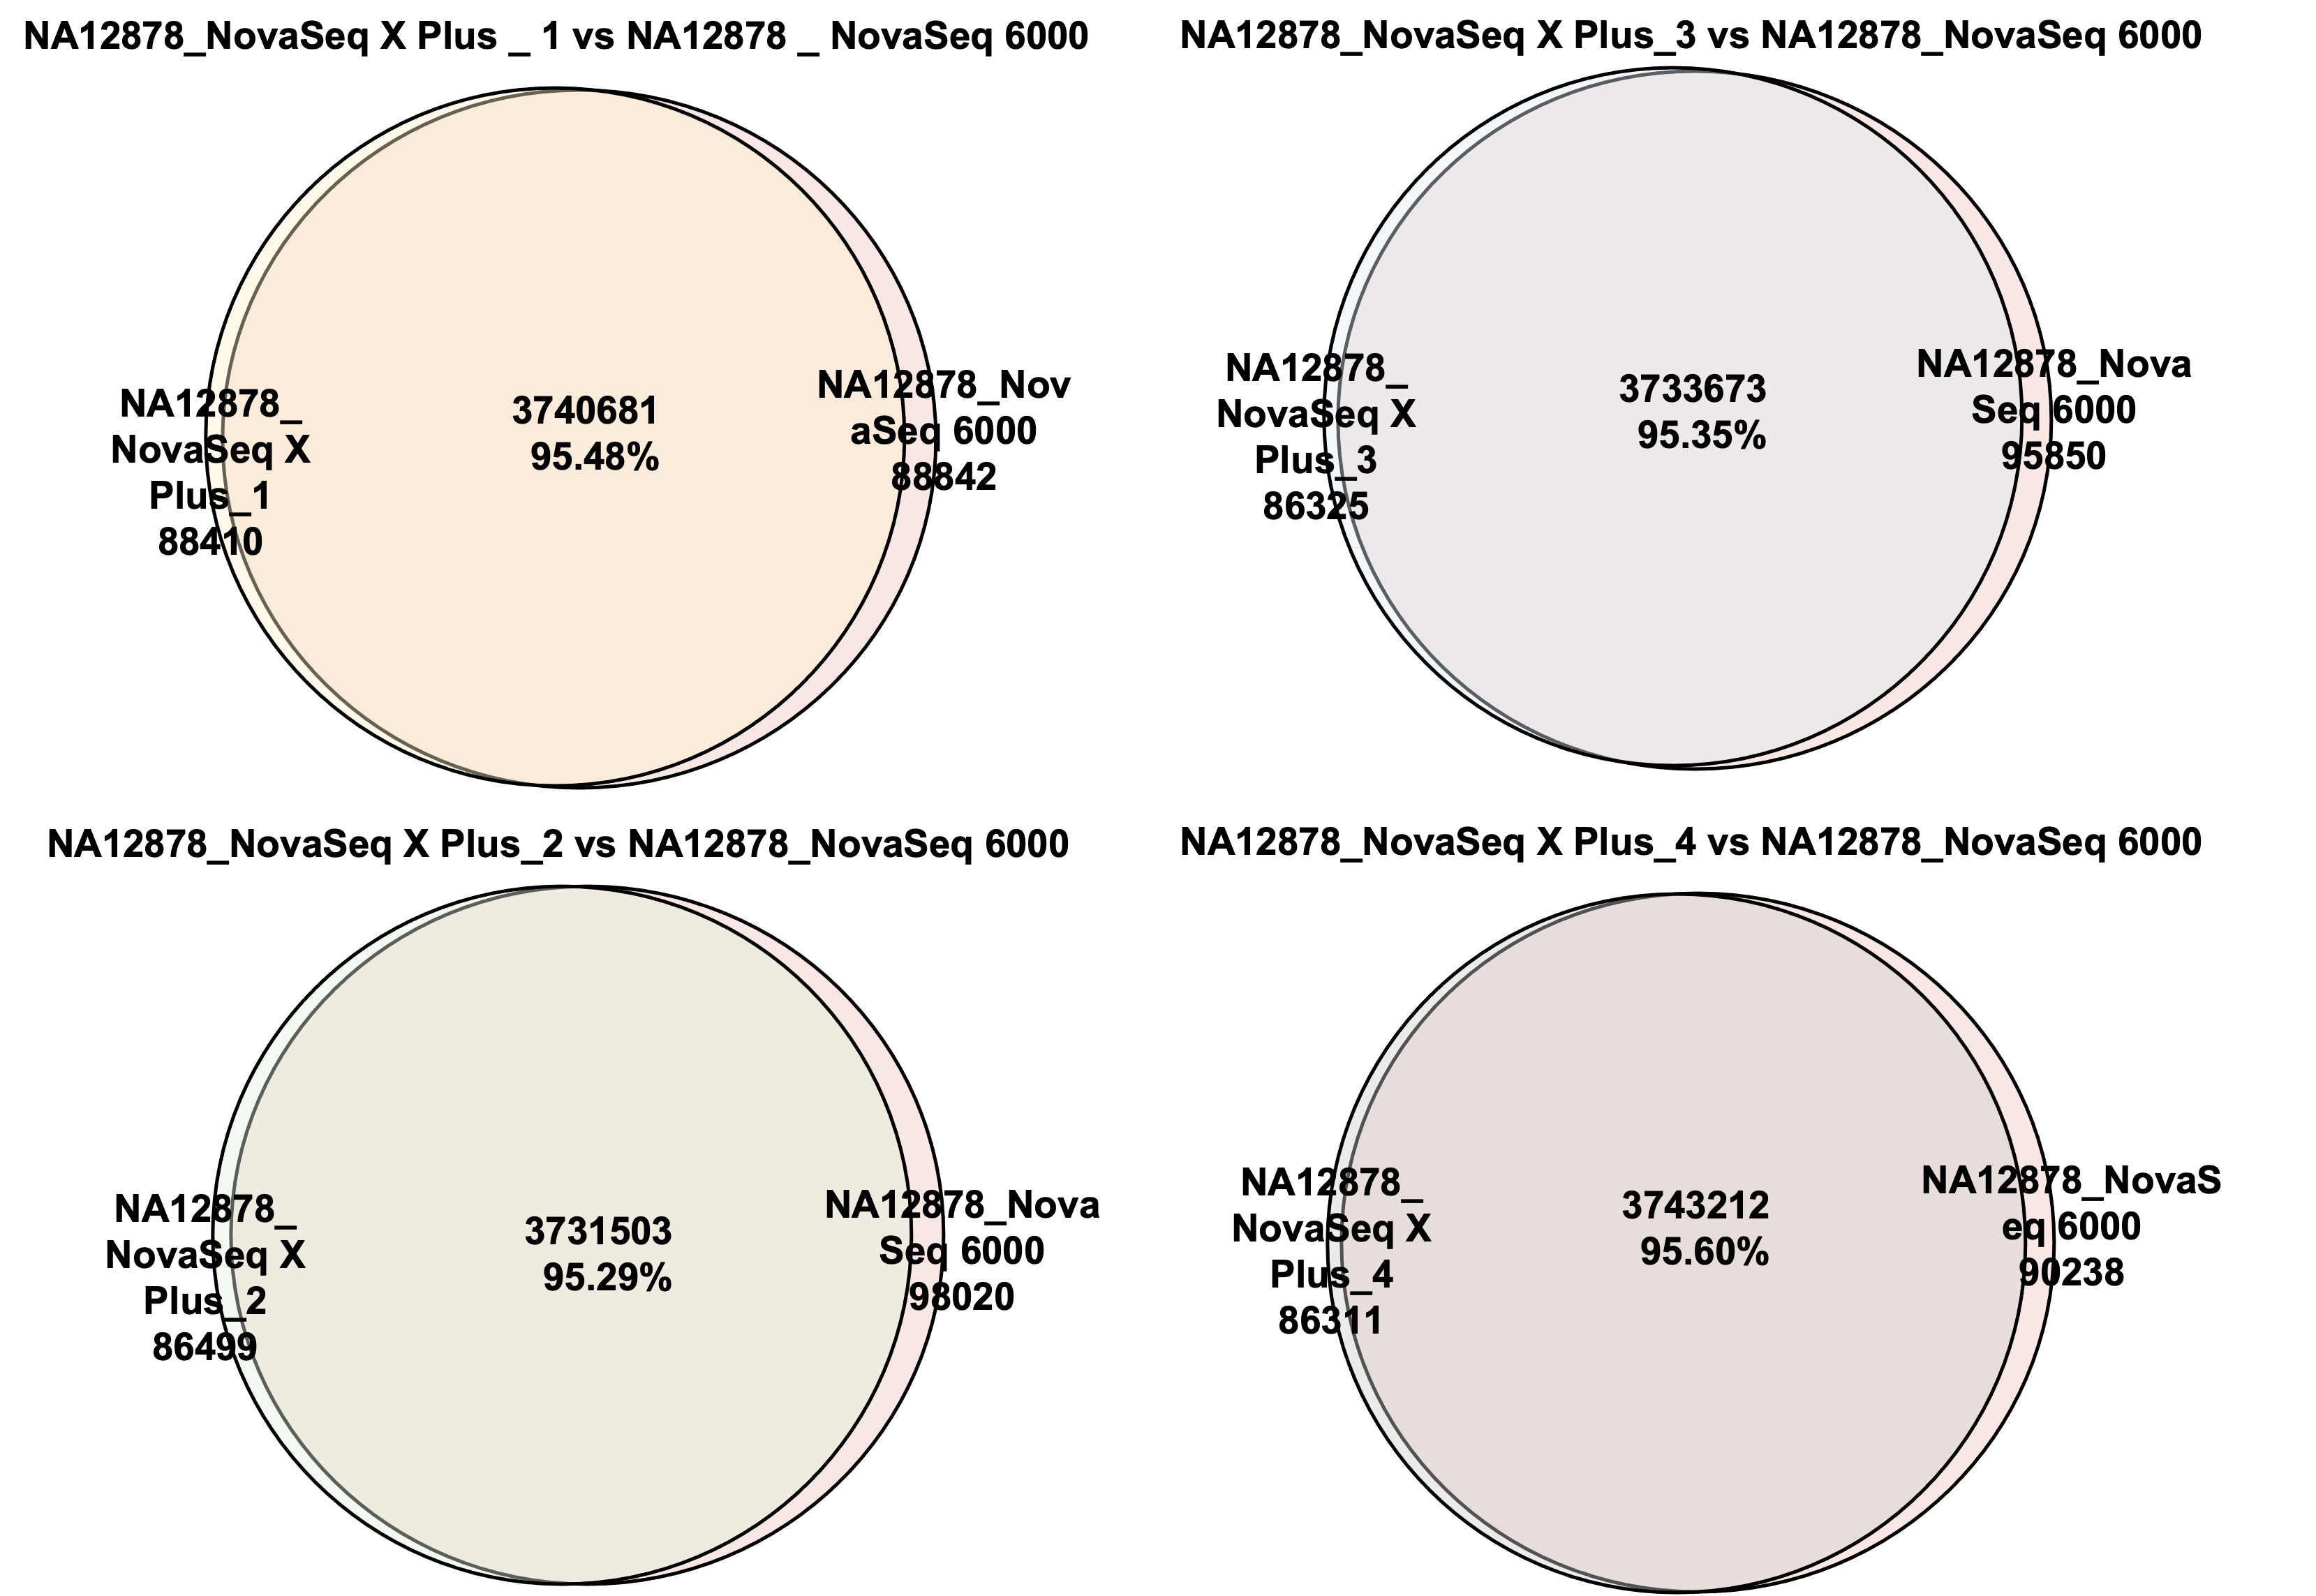 Figure 1 Venn diagrams of shared SNPs between NovaSeq X Plus and NovaSeq 6000
High data concordance between samples sequenced on separate lanes was observed on the NovaSeq X Plus and NovaSeq 6000 platforms. This demonstrates the high reproducibility of variant detections between sequencing runs and the high data quality achievable with our workflow on the latest sequencing platforms.
About Novogene
Novogene is a pioneer in applying cutting-edge molecular biology technology and high-performance computing to research in the fields of life science and human health. Our vision is to continue as a global leader in the delivery of genomics services and solutions.
With one of the largest sequencing capacities in the world, we utilise our deep scientific knowledge, first-class customer service and unsurpassed data quality to help clients realise their research goals in the rapidly evolving world of genomics. Novogene is committed to become your trusted genomics partner.
(2) Error: The average error rate of all bases on read1 and read2; the error rate of a base is obtained from equation 1.
(3) Q20: The percent of bases with phred-scaled quality scores greater than 20.
(4) Q30: The percent of bases with phred-scaled quality scores greater than 30.
(5) GC content: The percentage of G and C in all bases.
(6) Containing N: read pairs in either one read of which more than 10% of bases are uncertain.
(7) Low Quality: read pairs in either one read of which the proportion of low-quality bases is over 50%.
(8) Adapter Related: read pairs that contain adapter contamination in either one read.
(9) Mapped: The number of reads that mapped to the reference genome (percentage).
(10) Properly: The number of reads that mapped to the reference genome and within the expected insert size (percentage).
(11) PE mapped: The number of pair-end reads that mapped to the reference genome (percentage).
(12) Average_sequencing_depth: The average sequencing depth in the whole genome.
(13) Coverage: The coverage in the whole genome.
(14) 4X: The coverage in the whole genome when only bases with depth > 4X are considered.
(15) 10X: The coverage in the whole genome when only bases with depth > 10X are considered.
(16) 20X: The coverage in the whole genome when only bases with depth > 20X are considered.
(17) Precision=TP/(TP+FP) (percentage)
(18) Recall=TP/(TP+FN) (percentage)
(19) F-score=2* Precision*Recall/(Precision + Recall)
(20) dbSNP (SNP): The number of SNPs that have been reported in dbSNP database divided by the total number of SNPs.
(21) dbSNP (InDel): The number of InDels that have been reported in dbSNP database divided by the total number of InDels.