Shared SNP percentage >96% in exome library data and quantification correlation >97% in transcriptome library data – NovaSeq X Plus new data release
The NovaSeq X Plus platform provides extraordinary sequencing power not only for whole genome sequencing but also for whole exome sequencing and transcriptome sequencing. Following the previous release of human whole genome sequencing test on the NovaSeq X Plus, data from more library types are now available. Try a NovaSeq X Plus lane with Novogene!
1. Testing Result of Human Whole Exome Sequencing Library
To further evaluate the platform’s performance, a whole exome sequencing library with NA12878 was simultaneously sequenced on both the NovaSeq X Plus and NovaSeq 6000 platforms. The library was prepared using Agilent SureSelect Human All Exon V6.
1.1 Quality Control
Compared with the NovaSeq 6000, the NovaSeq X Plus platform performs better in Q30, with an average of 95.70%.
| Sample | Platform | Effective (%) | Error (%) | Q20 (%) | Q30 (%) | GC (%) | Containing N (%) | Low quality (%) | Adapter related (%) |
| S_W | NovaSeq 6000 | 97.88 | 0.02 | 98.31 | 95.19 | 51.97 | 0.00 | 0.00 | 2.11 |
| S_FC1_WL1X | NovaSeq X Plus | 97.19 | 0.03 | 97.59 | 95.73 | 51.26 | 0.01 | 0.00 | 2.8 |
| S_FC1_WL2X | NovaSeq X Plus | 97.00 | 0.02 | 97.87 | 96.13 | 51.26 | 0.01 | 0.00 | 2.99 |
| S_FC2_WL1X | NovaSeq X Plus | 97.83 | 0.03 | 97.23 | 95.56 | 50.58 | 0.00 | 0.00 | 2.17 |
| S_FC2_WL2X | NovaSeq X Plus | 97.73 | 0.03 | 97.21 | 95.37 | 50.66 | 0.00 | 0.00 | 2.27 |
1.2 Mapping Statistics
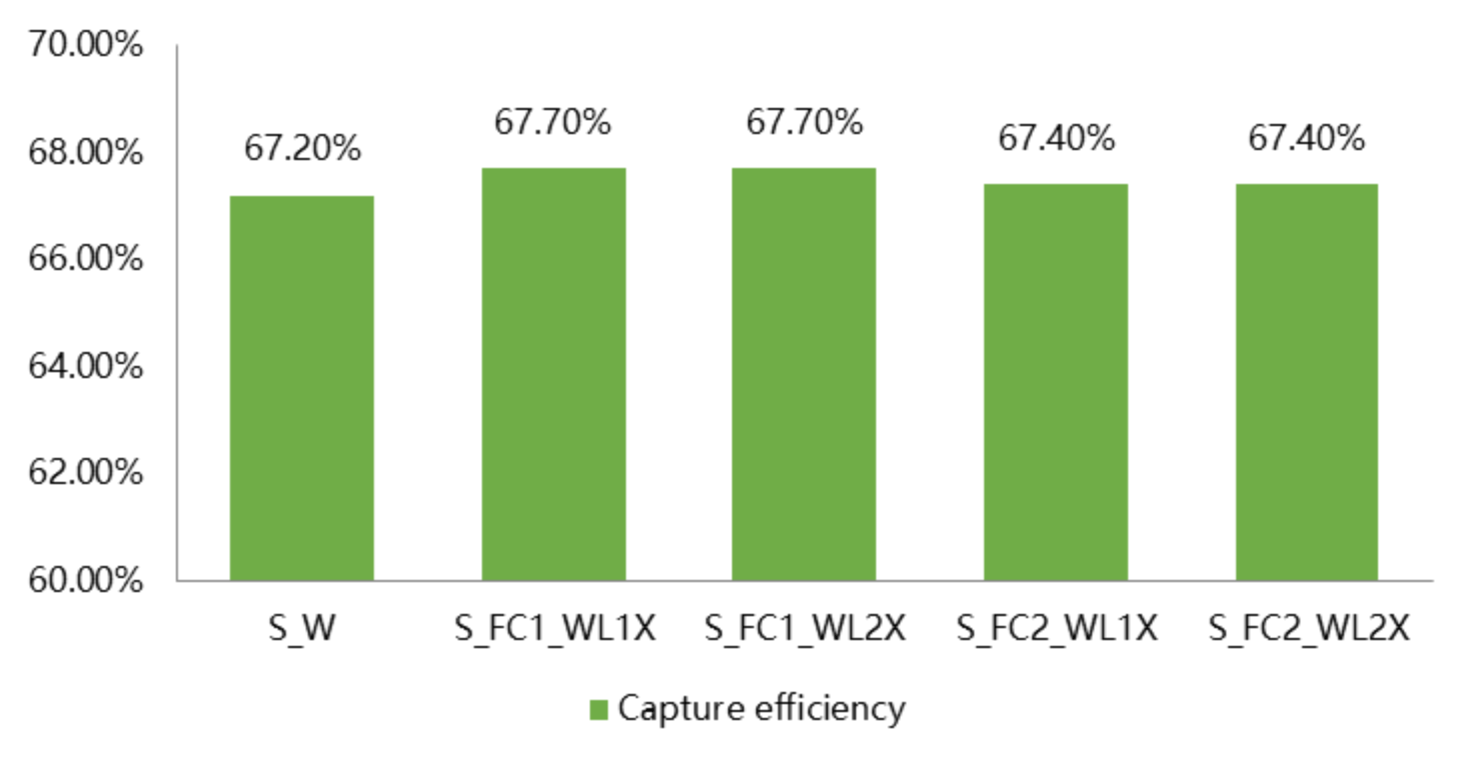
The NovaSeq X Plus achieves even coverage across the entire exome, with coverage of 99.5% and capture efficiency of 67.6%.
| Sample | Platform | Mapped (%) | Properly (%) | PE (%) | Coverage (%) | 4X (%) | 10X (%) | 20X (%) |
| S_W | NovaSeq 6000 | 99.94 | 98.98 | 99.90 | 99.50 | 99.10 | 98.00 | 95.10 |
| S_FC1_WL1X | NovaSeq X Plus | 99.92 | 99.16 | 99.89 | 99.50 | 99.00 | 97.70 | 94.70 |
| S_FC1_WL2X | NovaSeq X Plus | 99.91 | 99.16 | 99.88 | 99.50 | 99.00 | 97.70 | 94.60 |
| S_FC2_WL1X | NovaSeq X Plus | 99.92 | 99.15 | 99.89 | 99.50 | 99.00 | 97.70 | 94.70 |
| S_FC2_WL2X | NovaSeq X Plus | 99.91 | 99.13 | 99.87 | 99.50 | 99.00 | 97.70 | 94.70 |
1.3 Variant Calling Accuracy
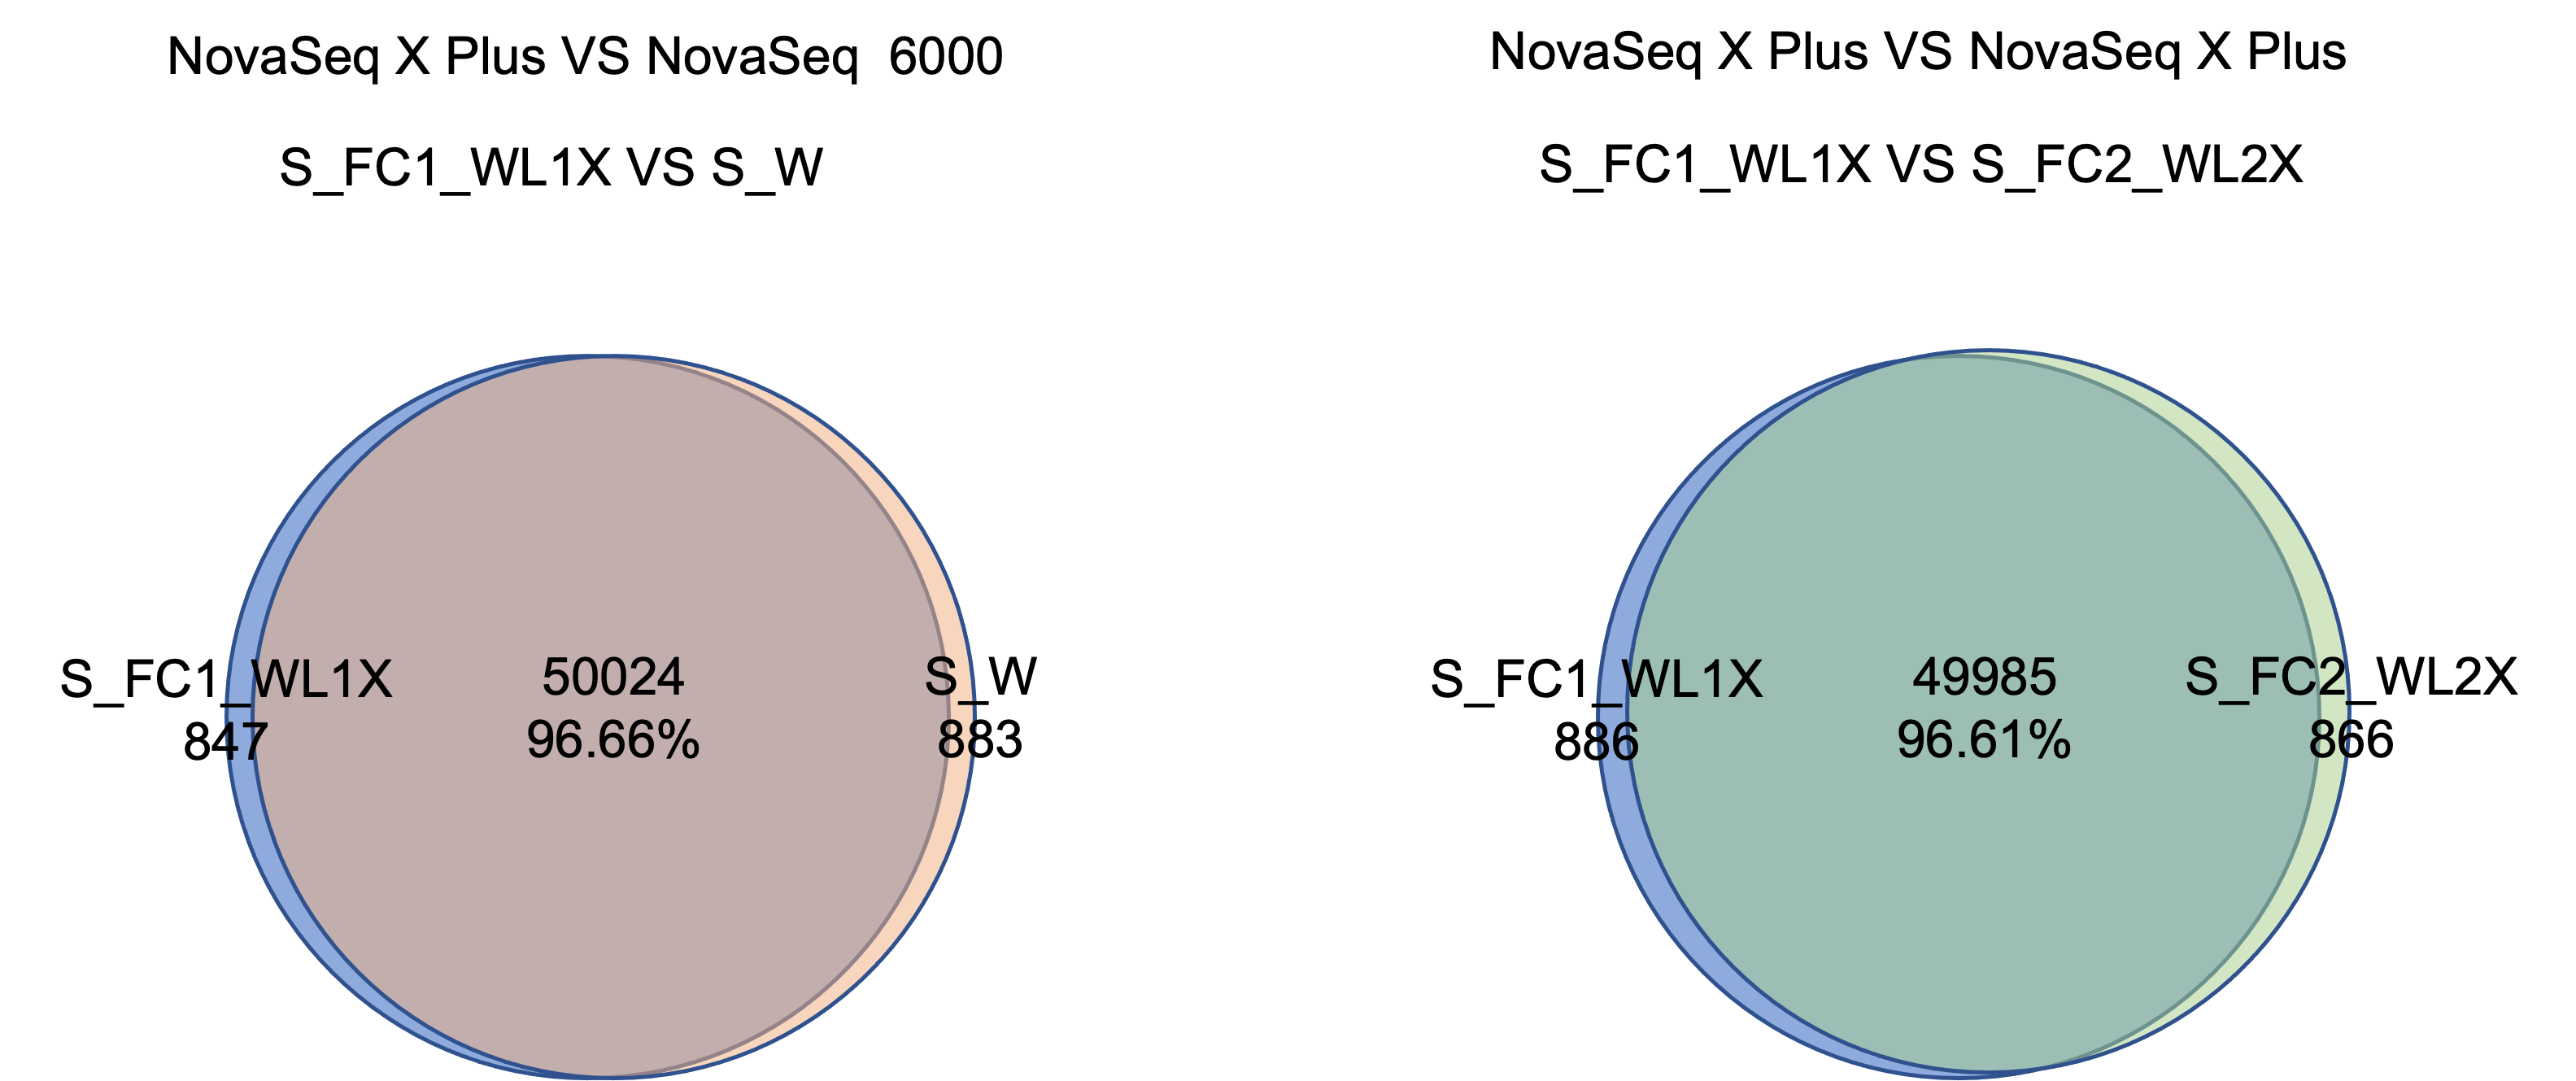
The NovaSeq X Plus and NovaSeq 6000 platforms have >96% similarity in SNP detection. The SNP and InDel precision and recall deviation between the two platforms is <0.5%.
| Sample | Platform | dbSNP (SNP) (%) | dbSNP (InDel)(%) | Precision (SNP) (%) | Recall (SNP) (%) | F-score (SNP) (%) | Precision (InDel) (%) | Recall (InDel) (%) | F-score (InDel) (%) |
| S_W | NovaSeq 6000 | 94.02 | 86.36 | 99.05 | 96.81 | 97.92 | 89.43 | 89.28 | 89.35 |
| S_FC1_WL1X | NovaSeq X Plus | 94.34 | 86.95 | 98.92 | 96.67 | 97.79 | 88.81 | 89.62 | 89.21 |
| S_FC1_WL2X | NovaSeq X Plus | 93.94 | 86.39 | 98.87 | 96.71 | 97.78 | 88.78 | 90.39 | 89.58 |
| S_FC2_WL1X | NovaSeq X Plus | 94.72 | 87.70 | 98.90 | 96.48 | 97.67 | 88.86 | 89.19 | 89.03 |
| S_FC2_WL2X | NovaSeq X Plus | 94.69 | 87.34 | 98.81 | 96.56 | 97.67 | 88.58 | 89.39 | 88.98 |
2. Testing Result of mRNA Sequencing library
An mRNA sequencing library with UHRR was simultaneously sequenced on both the NovaSeq X Plus and NovaSeq 6000 to further evaluate the platform performance.
2.1 Quality Control and Mapping Statistics
The effective rate, Q30 score, and rRNA rate of NovaSeq X Plus are almost similar to that of NovaSeq 6000, with <1% deviation.
| Sample | Platform | Effective (%) | Error rate (%) | Q20 (%) | Q30 (%) | GC (%) | rRNA (%) |
| UHRR | NovaSeq 6000 | 95.85 | 0.02 | 98.28 | 95.05 | 50.15 | 2.24 |
| UHRR_L1 | NovaSeq X Plus | 94.21 | 0.03 | 97.33 | 95.28 | 49.19 | 1.48 |
| UHRR_L2 | NovaSeq X Plus | 93.85 | 0.02 | 97.70 | 95.79 | 49.15 | 1.24 |
| UHRR_L3 | NovaSeq X Plus | 95.54 | 0.03 | 97.07 | 95.25 | 48.47 | 1.58 |
| UHRR_L4 | NovaSeq X Plus | 95.44 | 0.03 | 97.02 | 95.02 | 48.55 | 1.23 |
| Sample | Platform | Mapped (%) | Unique map (%) | Multi map (%) | Exon (%) |
| UHRR | NovaSeq 6000 | 95.71 | 92.85 | 2.86 | 90.16 |
| UHRR_L1 | NovaSeq X Plus | 94.90 | 92.34 | 2.56 | 90.16 |
| UHRR_L2 | NovaSeq X Plus | 95.05 | 92.39 | 2.66 | 90.13 |
| UHRR_L3 | NovaSeq X Plus | 90.19 | 87.90 | 2.28 | 90.07 |
| UHRR_L4 | NovaSeq X Plus | 92.37 | 90.08 | 2.29 | 90.08 |
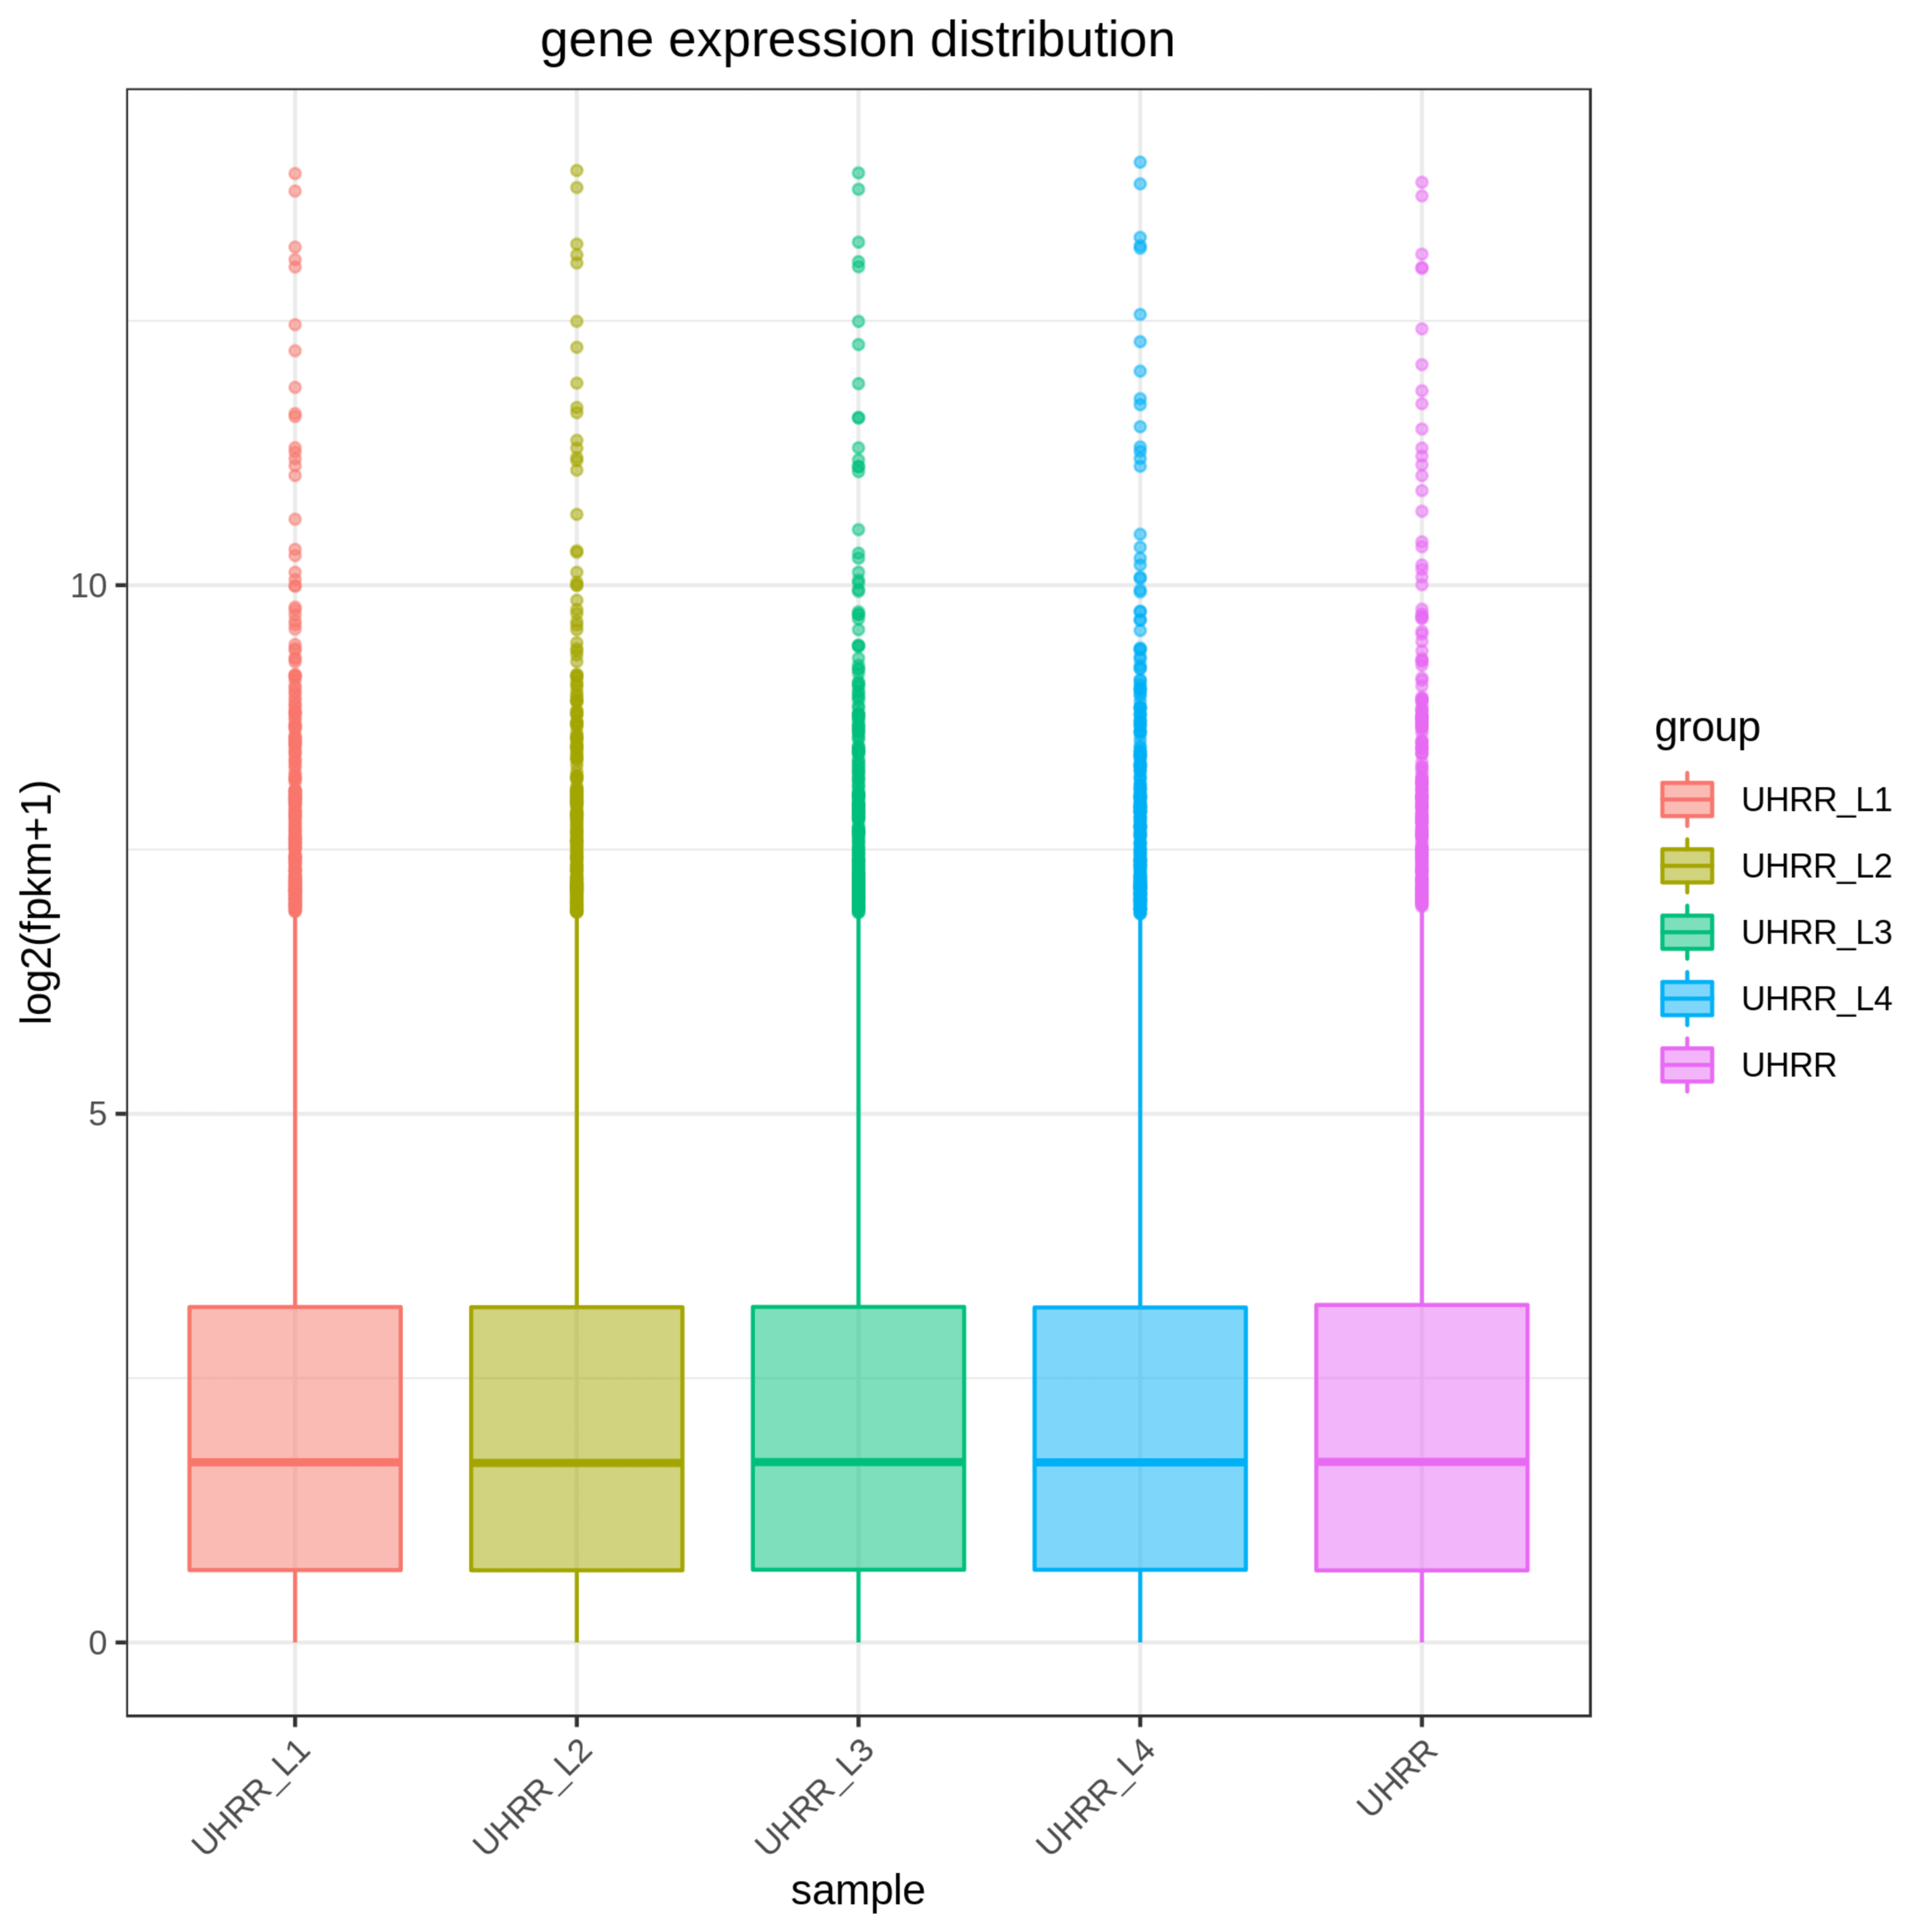
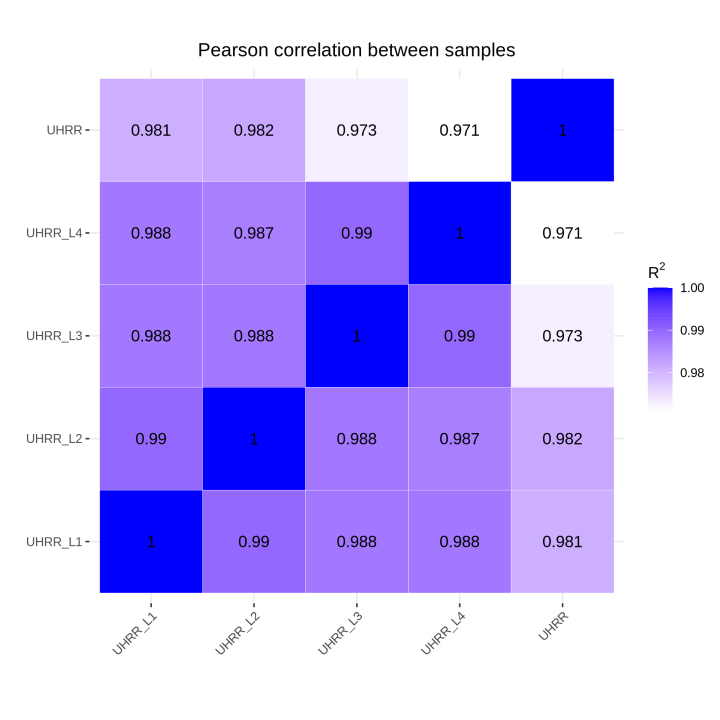
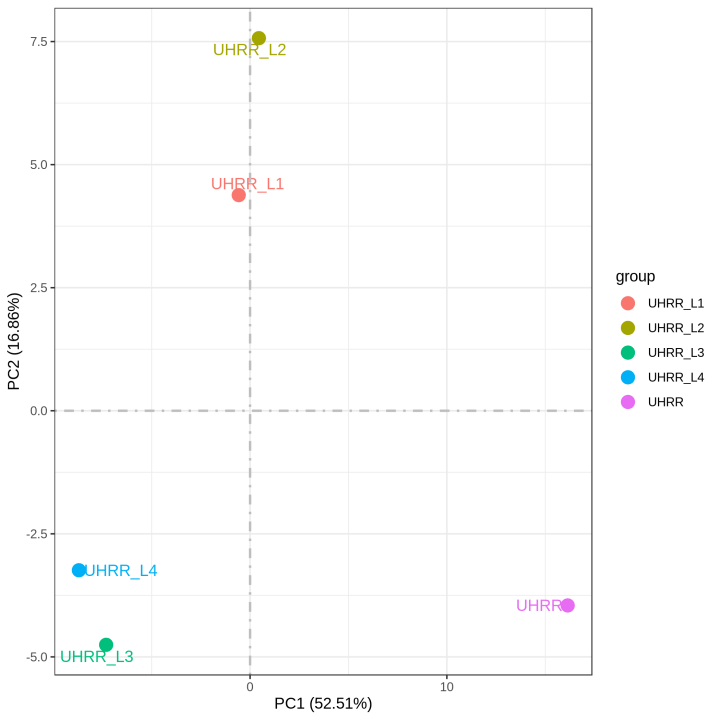
2.2 Quantification and Correlation
The quantification results indicate that the NovaSeq X Plus and NovaSeq 6000 platforms have high similarity in gene expression. The R2 value between the two platforms is >0.97, which is comparable to the R2 value between two lanes in the NovaSeq X Plus.
3. Testing Result of LncRNA Sequencing Library
LncRNA sequencing library with UHRR was simultaneously sequenced on the NovaSeq X Plus and NovaSeq 6000 to further evaluate the platform performance.
3.1 Quality Control and Mapping Statistics
When compared to the NovaSeq 6000, the effective rate, Q30 and rRNA rate of the LncRNA sequencing library on the NovaSeq X Plus showed almost identical results, with <1% deviation.
| Sample | Platform | Effective (%) | Error rate (%) | Q20 (%) | Q30 (%) | GC (%) | rRNA (%) |
| UHRR_control | NovaSeq 6000 | 98.42 | 0.02 | 98.14 | 94.63 | 51.17 | 0.60 |
| UHRR_Lnc1 | NovaSeq X Plus | 97.74 | 0.03 | 97.09 | 94.83 | 49.94 | 0.29 |
| UHRR_Lnc2 | NovaSeq X Plus | 97.58 | 0.03 | 97.49 | 95.37 | 49.93 | 0.33 |
| UHRR_Lnc3 | NovaSeq X Plus | 98.16 | 0.03 | 96.83 | 94.63 | 49.20 | 0.27 |
| Sample | Platform | Mapped (%) | Unique map (%) | Multi map(%) | Exon map (%) |
| UHRR_control | NovaSeq 6000 | 96.83 | 93.54 | 3.29 | 68.14 |
| UHRR_Lnc1 | NovaSeq X Plus | 96.07 | 93.06 | 3.01 | 67.20 |
| UHRR_Lnc2 | NovaSeq X Plus | 96.22 | 93.09 | 3.12 | 67.11 |
| UHRR_Lnc3 | NovaSeq X Plus | 94.08 | 91.48 | 2.60 | 66.45 |
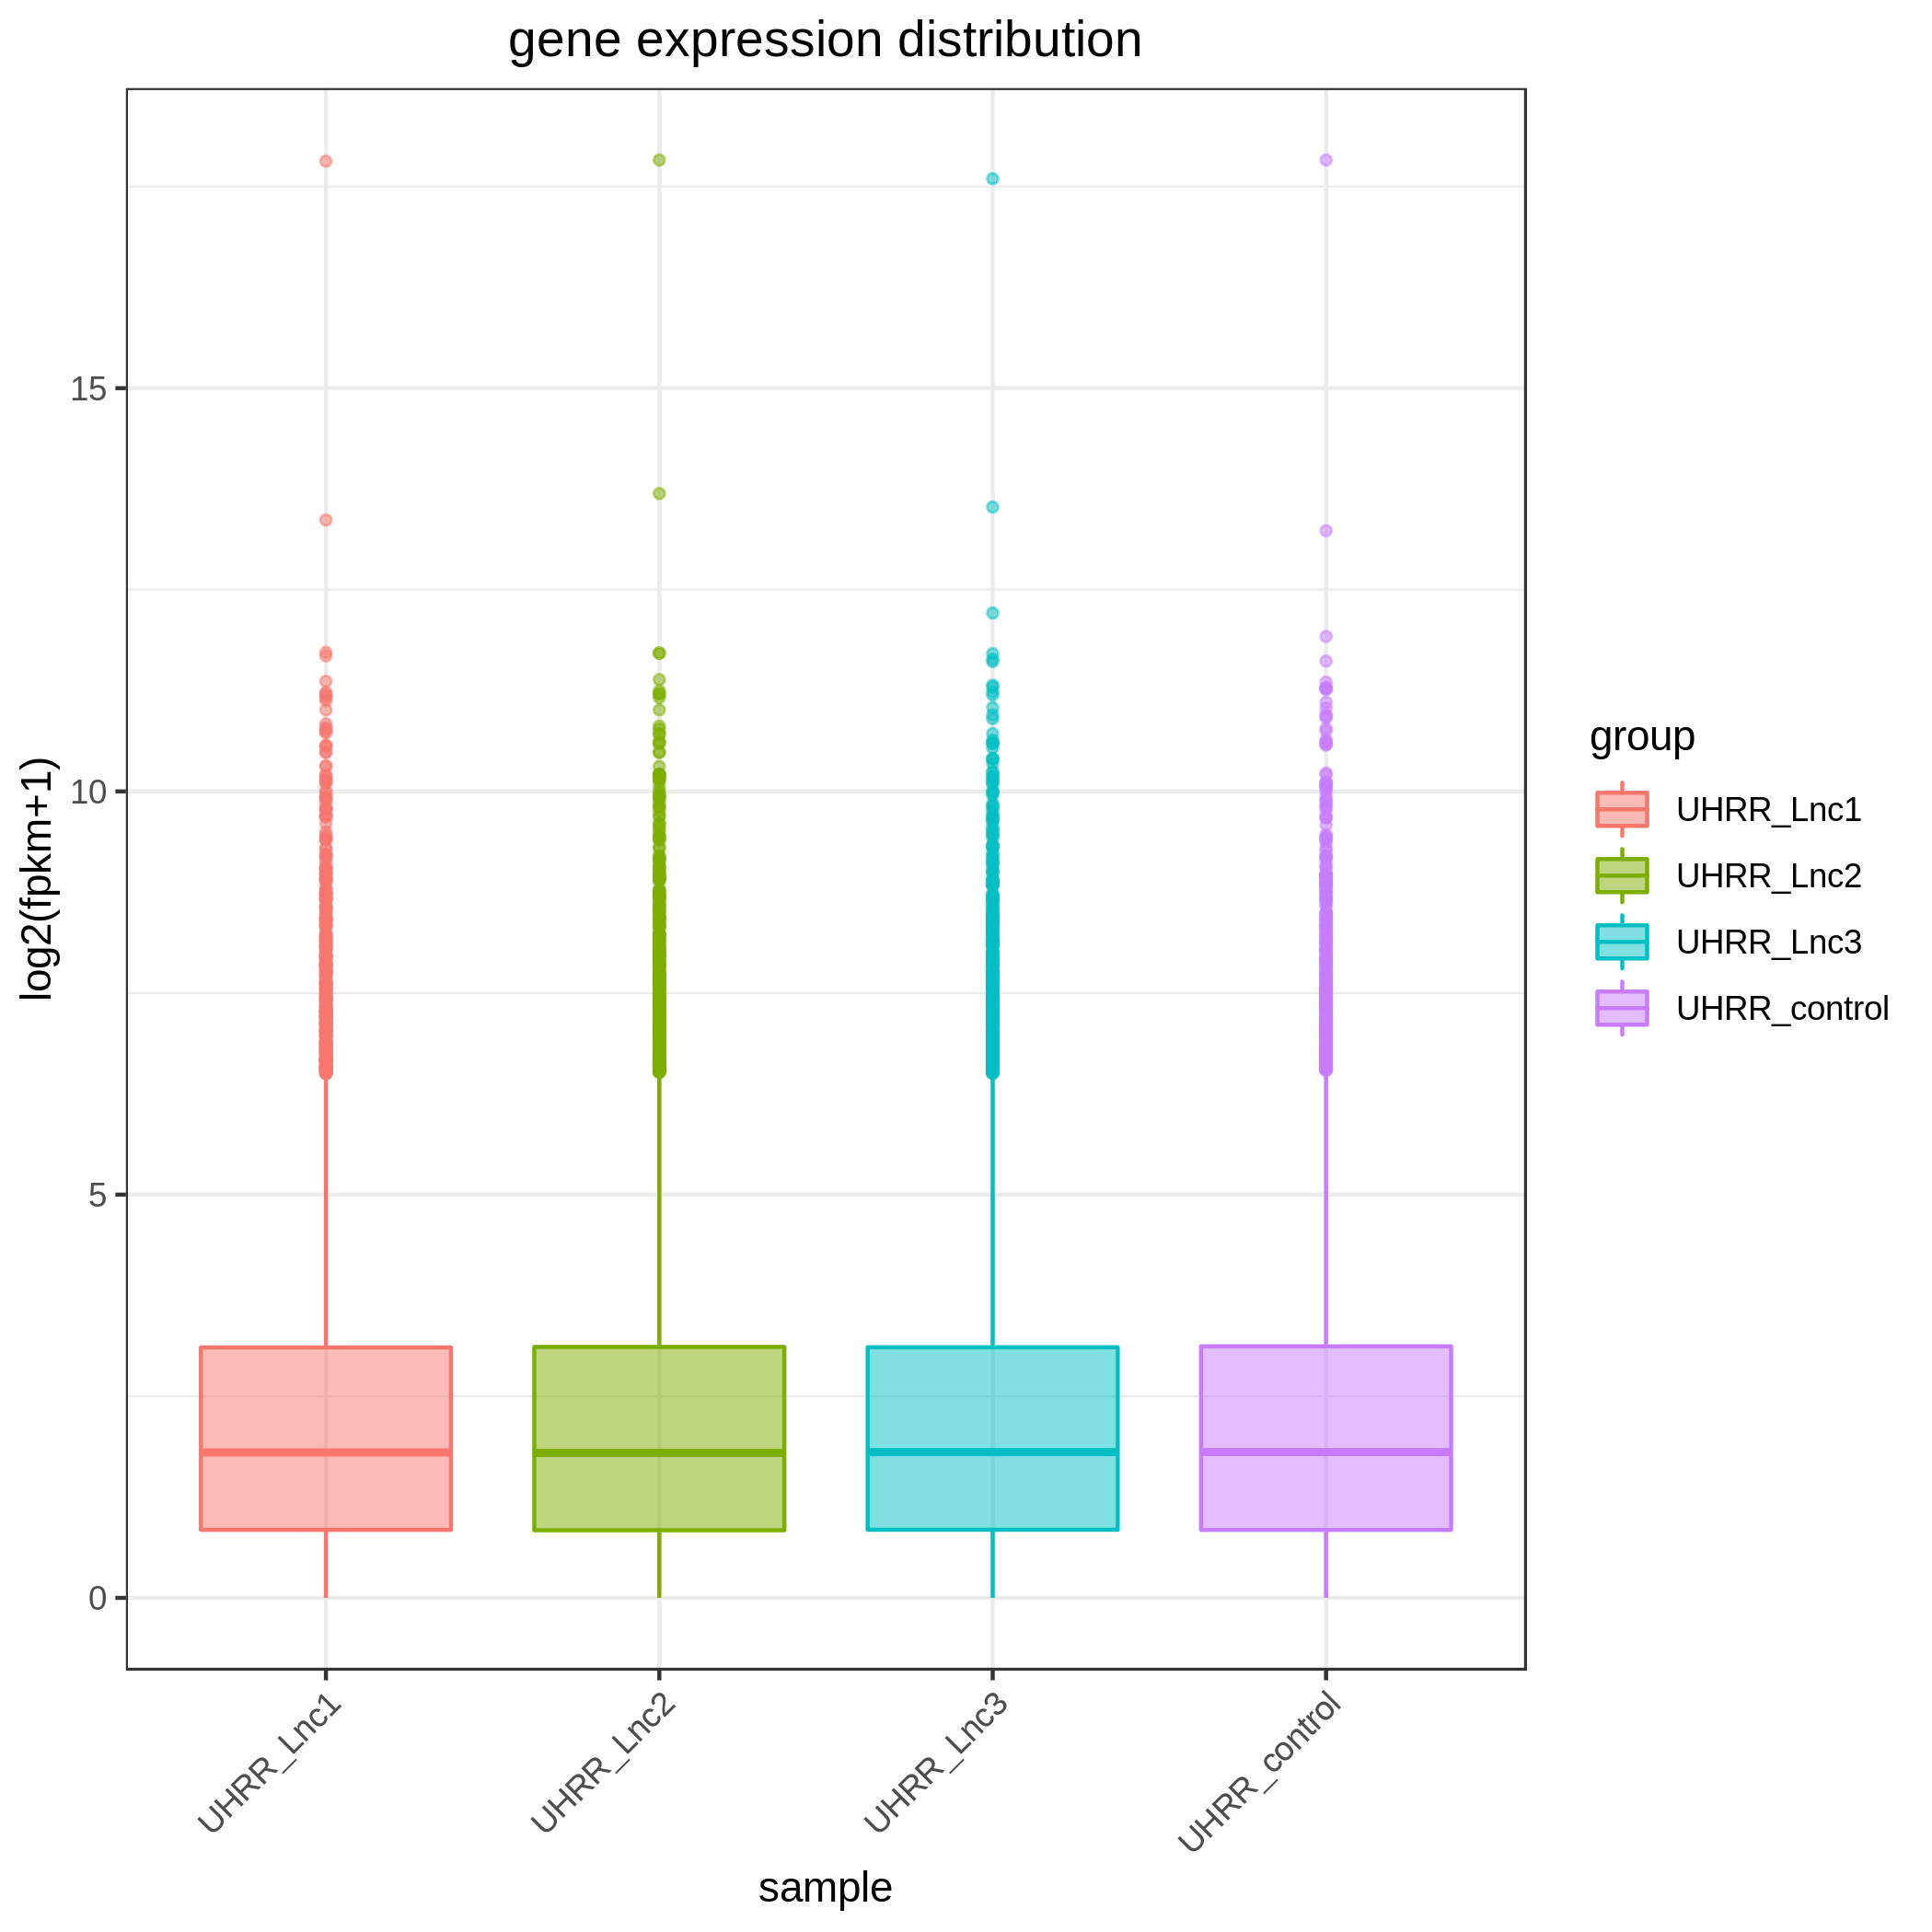
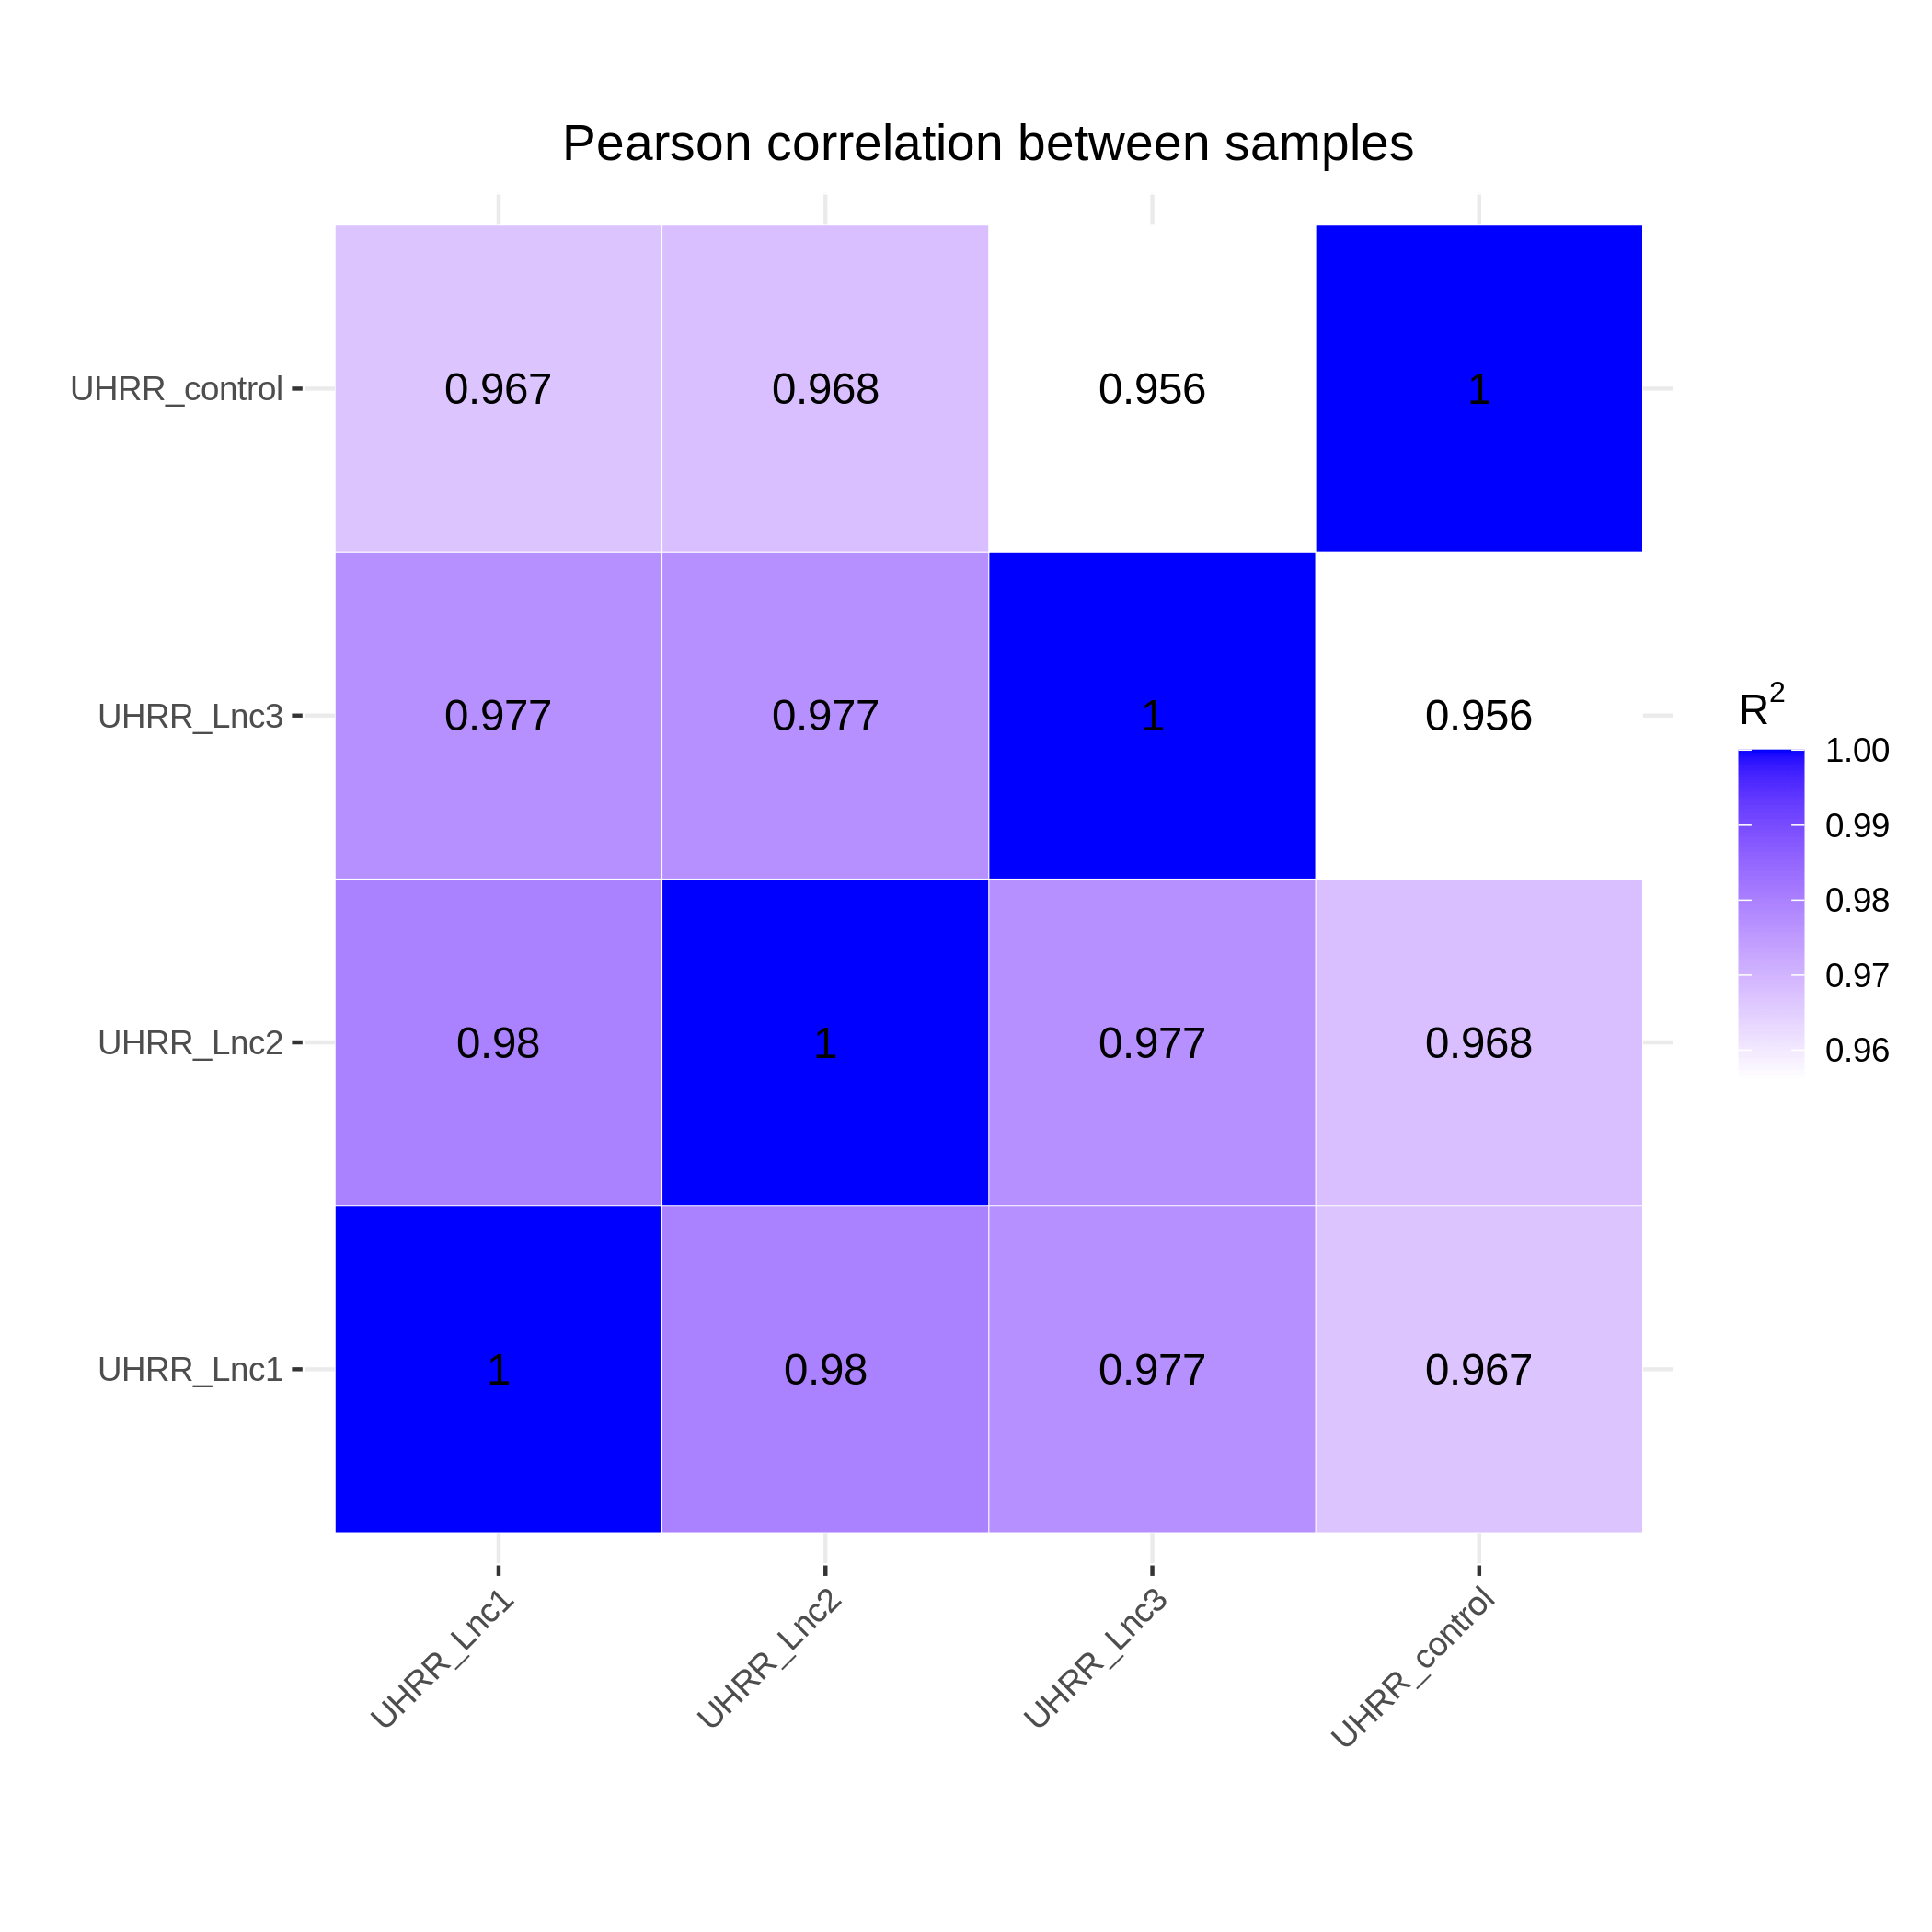
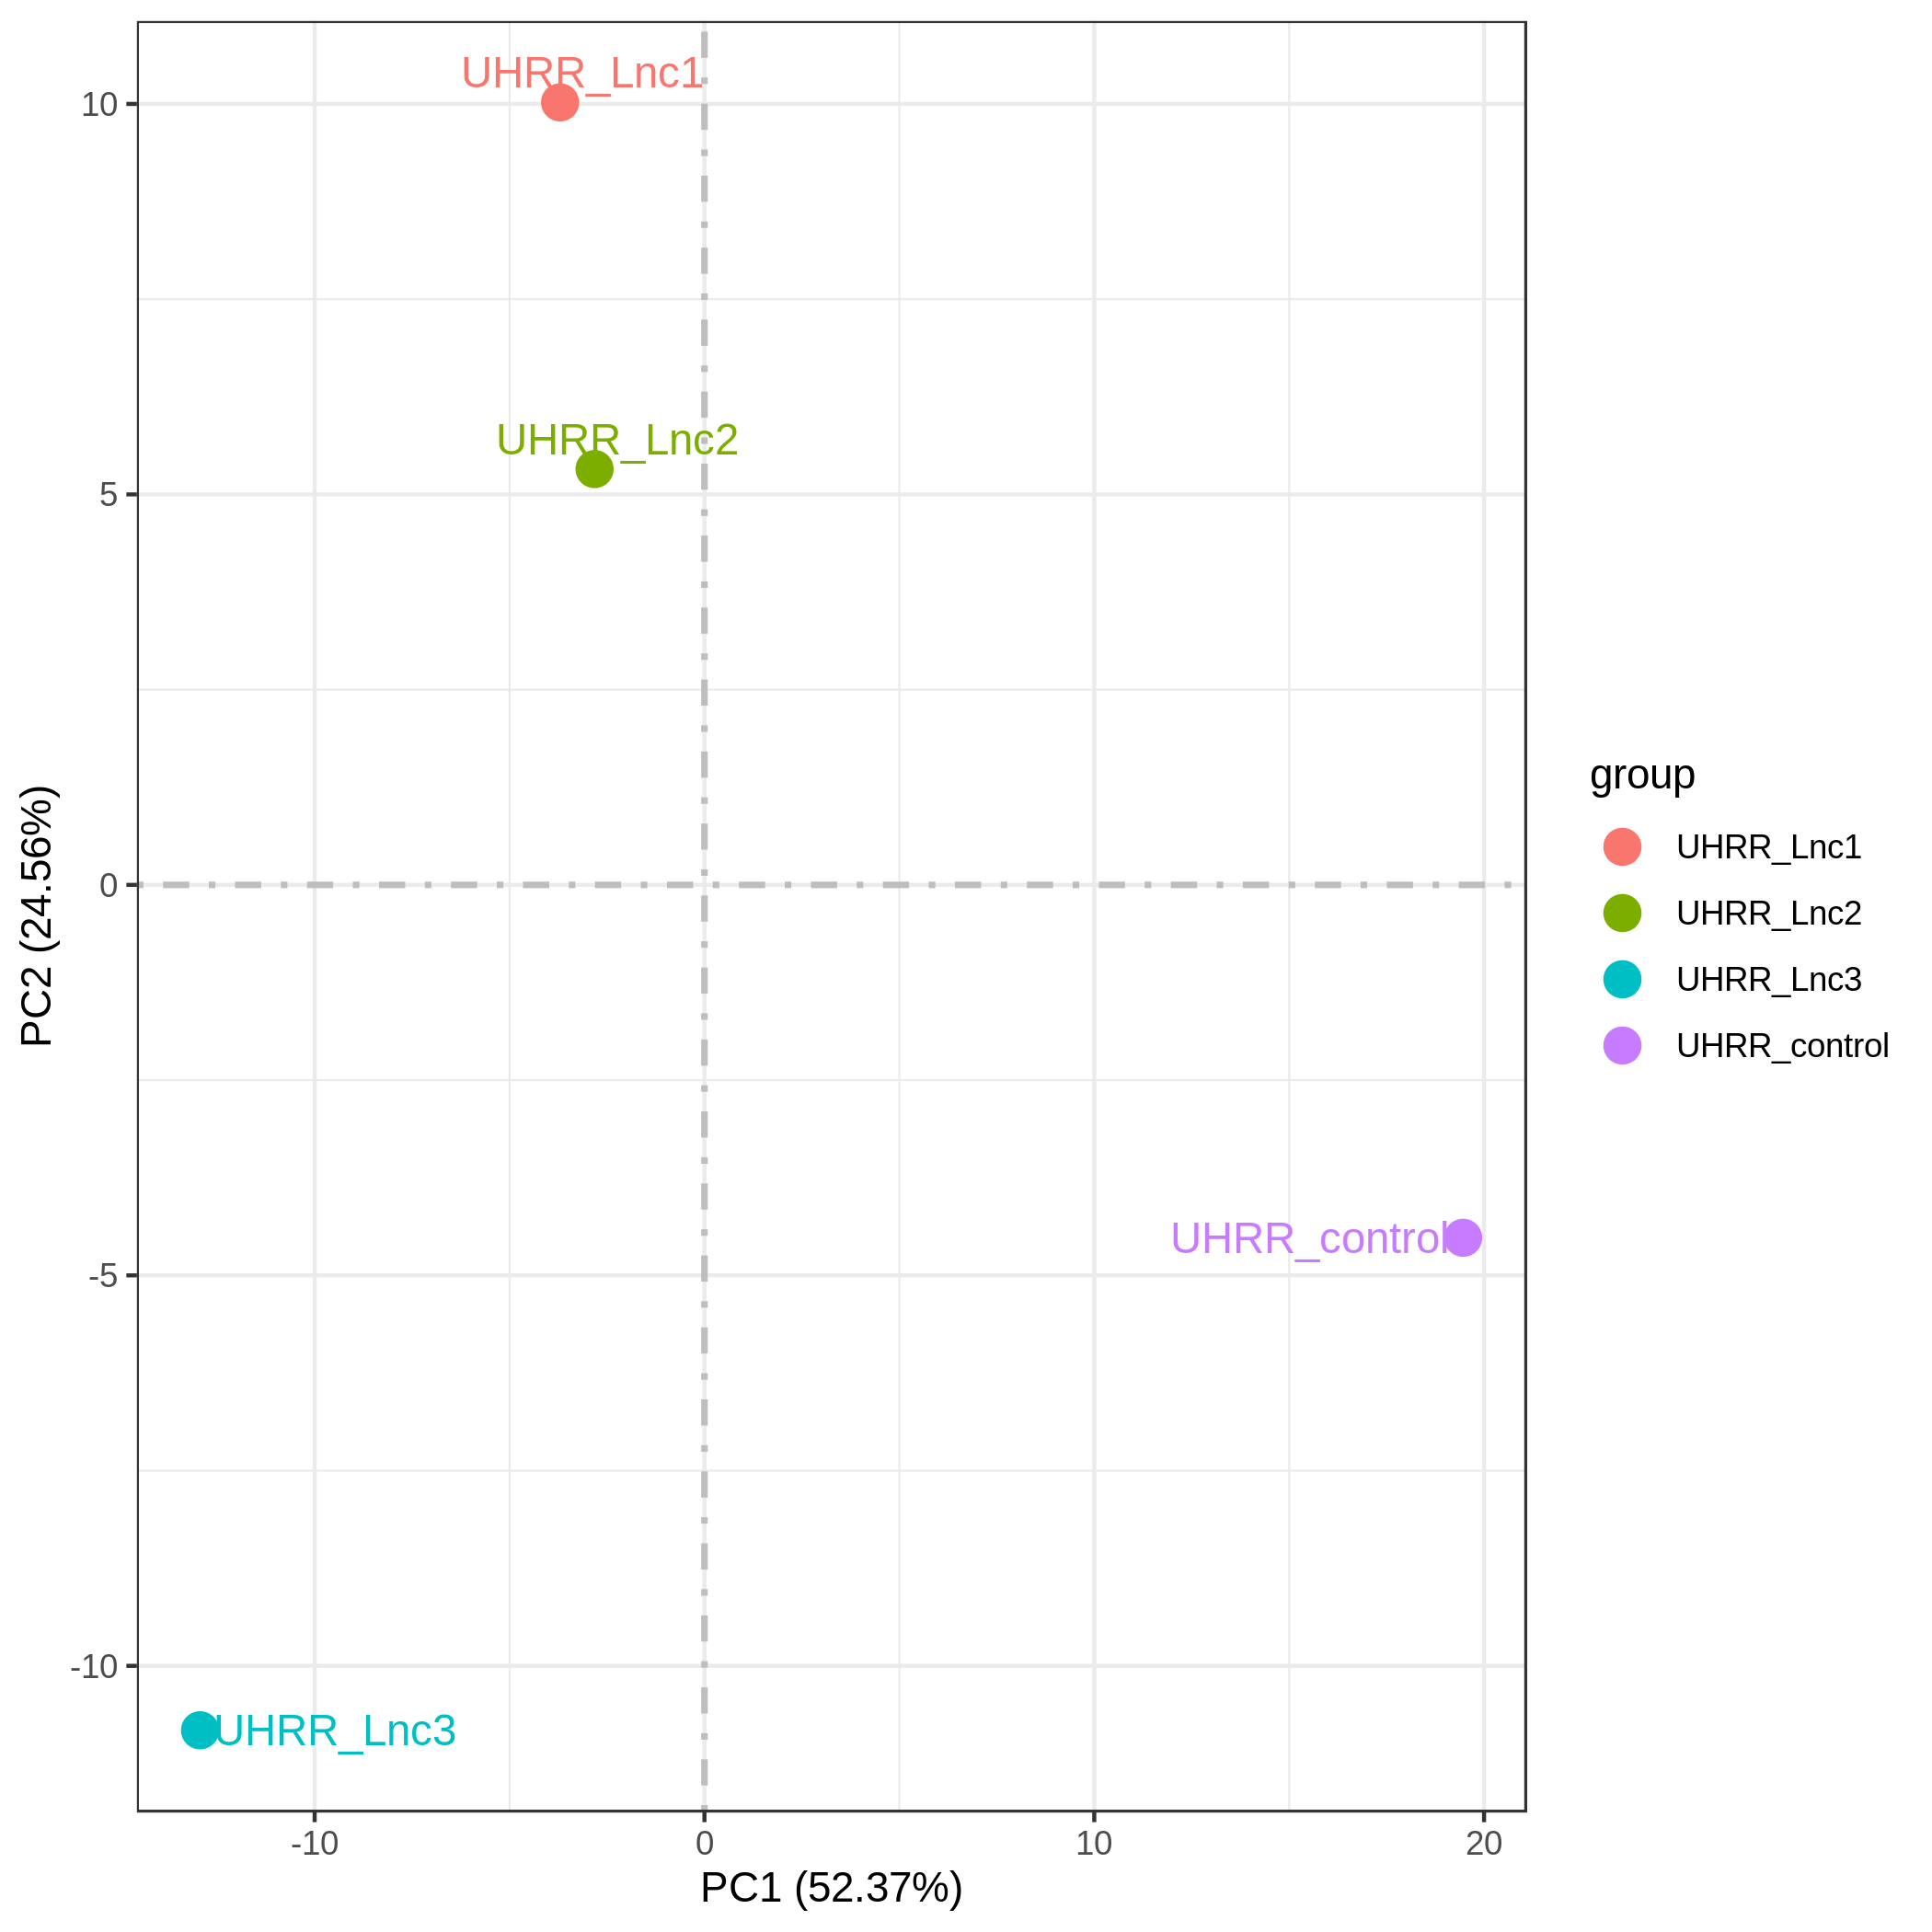
3.2 Quantification and Correlation
The quantification results indicate that the gene expression similarity between the NovaSeq X Plus and the NovaSeq 6000 is high, with an R2 value >0.96, which is similar to the R2 value between two lanes on the NovaSeq X Plus platform.
In summary, the NovaSeq X Plus platform demonstrates improved data quality and high consistency with the NovaSeq 6000 in whole genome, whole exome, and transcriptome sequencing libraries. With its outstanding performance in data quality, turnaround time, and affordable price, the NovaSeq X Plus is an attractive option for studies related to population genomics, gene function and regulation.
About Novogene
Novogene is a pioneer in applying cutting-edge molecular biology technology and high-performance computing to research in the fields of life science and human health. Our vision is to continue as a global leader in the delivery of genomics services and solutions.
With one of the largest sequencing capacities in the world, we utilise our deep scientific knowledge, first-class customer service and unsurpassed data quality to help clients realise their research goals in the rapidly evolving world of genomics. Novogene is committed to become your trusted genomics partner.
(2) Error: The average error rate of all bases on read1 and read2; the error rate of a base is obtained from equation 1.
(3) Q20: The percent of bases with phred-scaled quality scores greater than 20.
(4) Q30: The percent of bases with phred-scaled quality scores greater than 30.
(5) GC content: The percentage of G and C in all bases.
(6) Containing N: read pairs in either one read of which more than 10% of bases are uncertain.
(7) Low Quality: read pairs in either one read of which the proportion of low-quality bases is over 50%.
(8) Adapter Related: read pairs that contain adapter contamination in either one read.
(9) Mapped: The number of reads that mapped to the reference genome (percentage).
(10) Properly: The number of reads that mapped to the reference genome and within the expected insert size (percentage).
(11) PE mapped: The number of pair-end reads that mapped to the reference genome (percentage).
(12) Coverage: The coverage in the whole genome.
(13) 4X: The coverage in the whole genome when only bases with depth > 4X are considered.
(14) 10X: The coverage in the whole genome when only bases with depth > 10X are considered.
(15) 20X: The coverage in the whole genome when only bases with depth > 20X are considered.
(16) Precision=TP/(TP+FP) (percentage)
(17) Recall=TP/(TP+FN) (percentage)
(18) F-score=2* Precision*Recall/(Precision + Recall)
(19) dbSNP (SNP): The number of SNPs that have been reported in dbSNP database divided by the total number of SNPs.
(20) dbSNP (InDel): The number of InDels that have been reported in dbSNP database divided by the total number of InDels.
(21) Unique_map: Number and percentage of reads aligned to the unique position of the reference genome (for subsequent quantitative data analysis), unique mapping rate: (uniquely mapped reads)/(total reads)*100.
(22) Multi_map: number and percentage of reads aligned to multiple locations in the reference genome, multiple mapping rate: (multiple mapped reads)/(total reads)*100.
(23) Error_rate:Average sequencing error rate, which is calculated by Qphred=-10log10(e).
(24) Exon: The number of reads aligned to exon regions of the genome and its proportion in clean reads.
(25) Exon map: The number of bases aligned to exon regions of the genome and its proportion to the number of bases aligned to the genome.