Data-independent acquisition (DIA) quantitative proteomics is a next-generation direct DIA technology based on the Astral mass spectrometry platform. It performs differential quantitative proteomic analysis using a DIA scanning mode. Narrow-window DIA is an ultra-fast quantitative analysis method that enables comprehensive proteome analysis with high sequencing depth. By combining quadrupole-orbitrap mass spectrometers with the Astral mass spectrometer, this approach achieves high scan speed, resolution, sensitivity, and low ppm mass accuracy.
This approach is particularly transformative in proteomics, where the goal is to identify and quantify a large number of proteins with high accuracy and reproducibility.
At Novogene, we offer Rapid DIA (180 SPD) / Deep DIA (60 SPD) (*SPD, Sample Per Day) solutions to meet diverse research needs.
Applications:
The Astral Orbitrap mass spectrometer using DIA proteomics is particularly suitable for a variety of high-throughput, high-sensitivity proteomic applications, including:
- Clinical and Biomedical Research including biomarker discovery, drug-protein interactions.
- Systems Biology and Functional Proteomics.
- Environmental and Agricultural Proteomics.
- Immunology and Infectious Disease Research.
Advantages and Features of Novogene's Services
- High Reproducibility, Stability & Reliability: Routine instrument maintenance and thorough sample quality control ensure the delivery of consistent and high-quality data.
- Comprehensive Protein Identification: Provide extensive proteomic coverage.
*Results may vary depending on sample quality and type.
- Expert Bioinformatic Analyses: We are able to perform diverse functional analyses for in-depth exploration and interpretation of your proteomic data.
- High Sample Throughput: Our Rapid DIA service processes up to 180 samples per day, making it ideal for large-scale cohort proteomic studies.
Sample Requirements:
| Product type | Sample Type | Recommended Sample Amount | |
| Quantitative Proteomics (Deep, Rapid DIA, blood Plus) | Animal Tissues | General Tissue (brain, heart, liver, spleen, lung, kidney, muscle, etc.) | 10 mg |
| Plant Tissues | Soft Tissues (leaves, flowers, roots of woody or herbaceous plants, algae, ferns, etc.) | 100 mg | |
| Fruit pulp | 2 g | ||
| Seeds | 100 mg | ||
| Pollen | 50 μL | ||
| Cells | Suspension/ Adherent cultured cells | 2×10^6 (10 μL cell pellet) | |
| Body Fluids | Serum/ Plasma (neat, no pretreatment) | 5 μL | |
| Serum/ Plasma (nanoparticle-based pretreatment) | 100 μL | ||
| Cerebrospinal fluid/Semen/ Follicular fluid/Saliva/Tear | 500 μL | ||
| Urine | 10 mL | ||
| Breast milk | 10 μL | ||
| Microorganisms | Common bacteria | 30 mg or 30 μL pellet | |
| Fungal mycelium | 50 mg or 50 μL pellet | ||
| Extracted Proteins (solvent buffer reagent components must be provided) | Non-detergent-containing protein sample (optimal buffer with | 100 μg | |
| 6M Urea, preferred protein concentration ≥ 0.5 μg/μL) | |||
| Detergent-containing protein sample (including SDS, Triton X-100, NP40, CHAPS, etc.) | 200 μg | ||
| *Beads (Protein A/G magnetic beads/Agarose beads – antigen-antibody complex) | 100 μg (estimated) | ||
*Please contact us for more information.
Specifications:
The Orbitrap Astral high-resolution mass spectrometer comprises three mass analyzers (as shown below). By integrating these analyzers, the system leverages their unique strengths to enhance performance and usability, ultimately improving its overall capabilities.
- Quadrupole mass analyzer: Enables precise precursor ion selection.
- Orbitrap mass analyzer: Delivers high-resolution, high dynamic range HRAM (High-Resolution Accurate Mass) spectra.
- Astral mass analyzer: Provides high-sensitivity detection and rapid acquisition of high dynamic range HRAM spectra at speeds of up to 200 Hz.
| Analyzer Type | Astral Mass Analyzer |
| Sensitivity | Single ion detection |
| HRAM scan rate | Up to 200 Hz |
| Interscan dynamic range | >1000 with single microscan |
| Resolution | 80,000 at m/z 524 |
| Mass accuracy | RMS <5 ppm |
| Mass range | m/z 40-6,000 |
| Scan mode | SIM, DDA, DIA, PRM |
Project Workflow
From tissue samples to the final data analysis, each step in the process can impact the quality and quantity of the data. This process includes protein extraction, quantification, enzymatic digestion, peptide desalting, data acquisition and analysis. To ensure the accuracy and reliability of proteomics data from the outset, Novogene implements rigorously quality control at every experimental step, ensuring the production of high-quality proteomics data. The experimental workflow is as follows:

FAQS
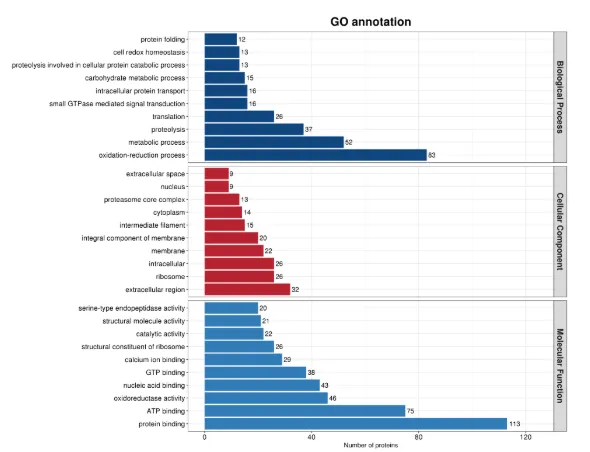
Bar Chart of GO Annotation Results
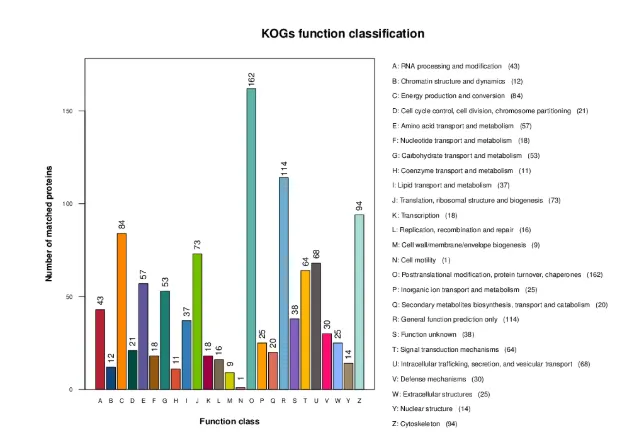
Cluster of Orthologous Groups of proteins
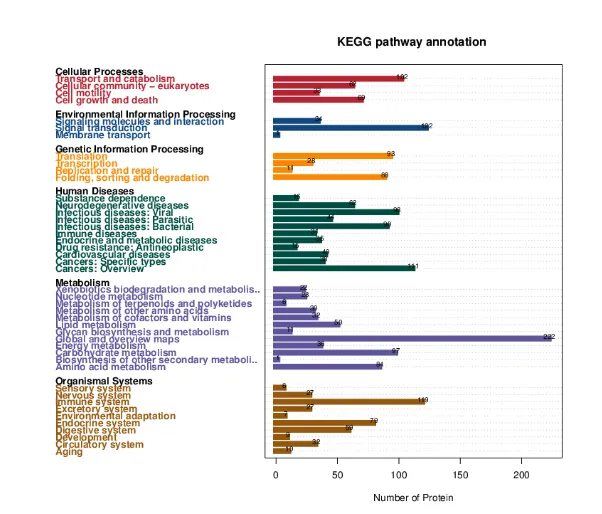
Bar Chart of KEGG Annotation Results
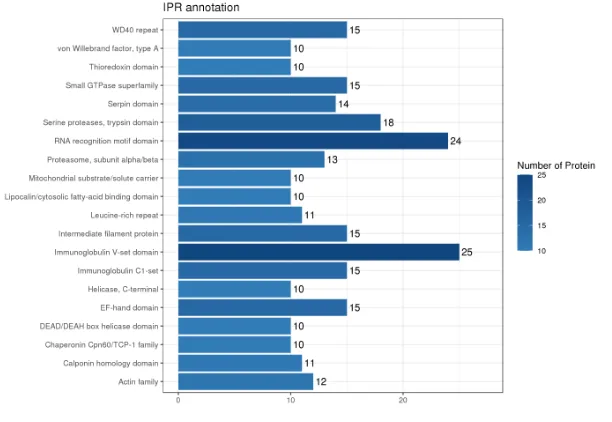
Bar Chart of Domain Annotation Results
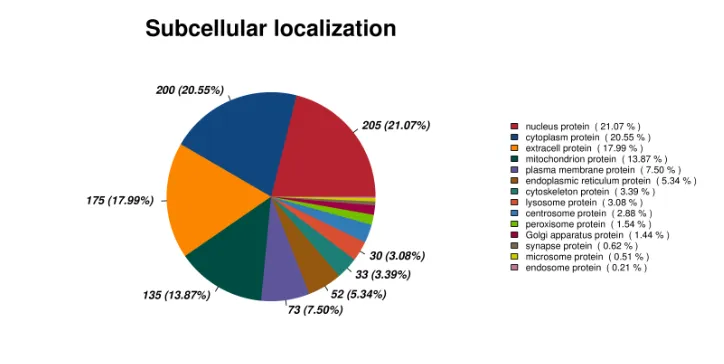
Pie Chart of Subcellular Localization Annotation Results
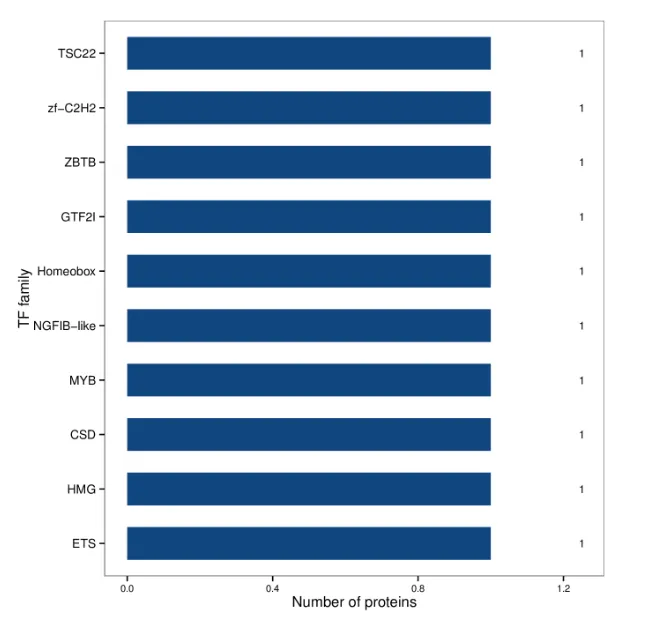
Bar Chart of Transcription Factor Annotation Results
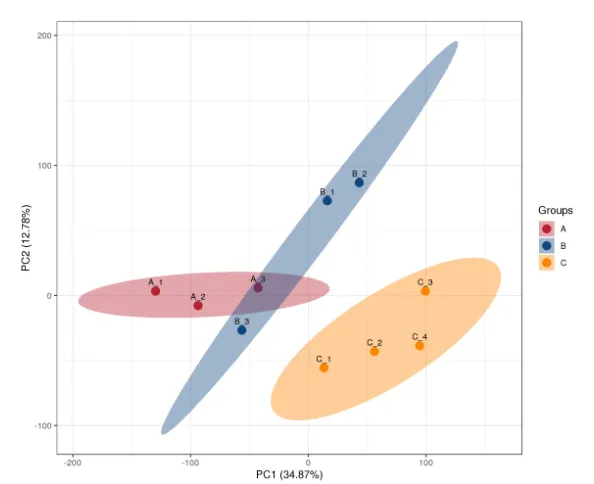
Principal Component Analysis (PCA)
An overall reflection of the protein differences between groups of samples and the degree of variation within the groups.
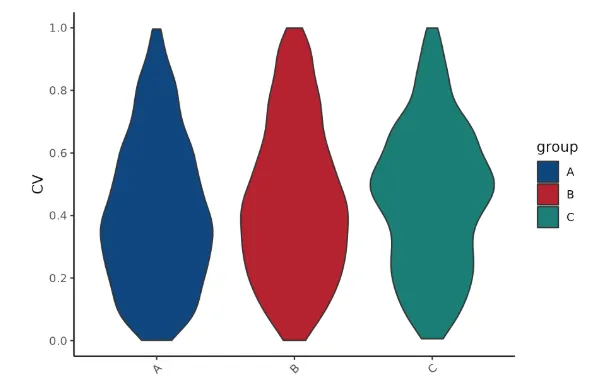
Repeatability CV Analysis
Measure the degree of variation of the observations in a sample.
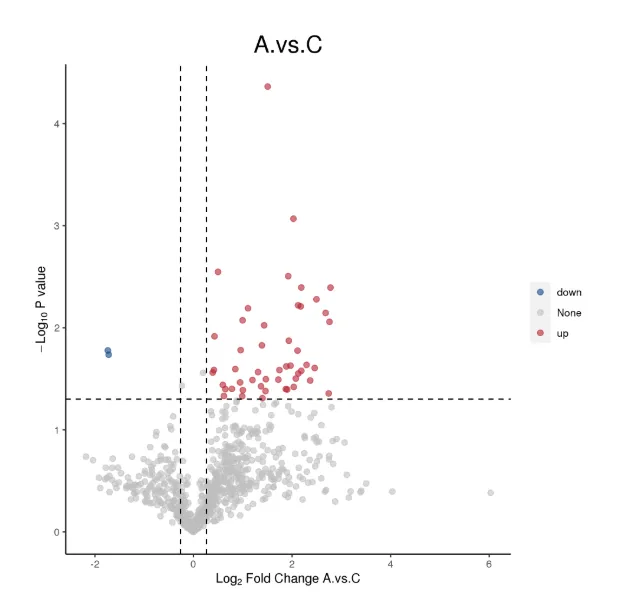
Volcano Plot of Differential Proteins
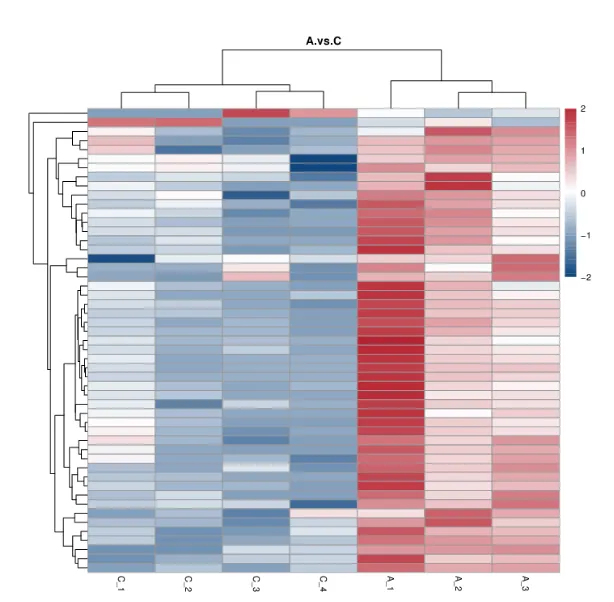
HCA Heatmap of Differential Proteins
To illustrate the up-regulation and down-regulation of different proteins when comparing different samples.
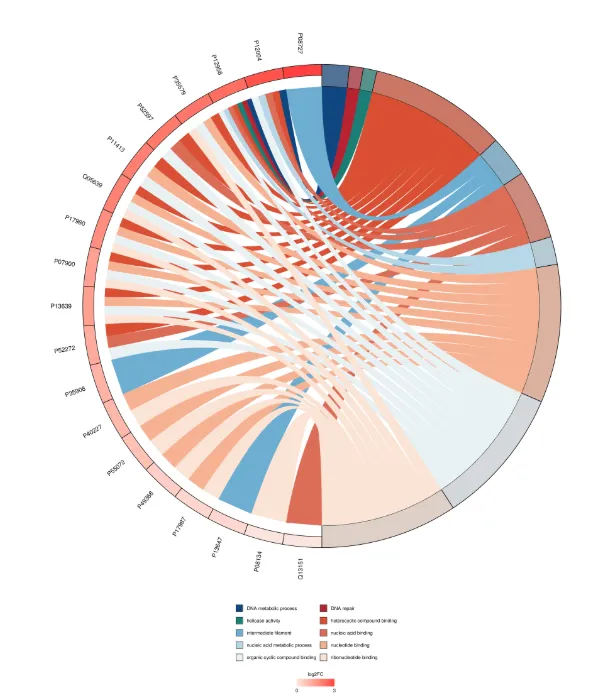
GO Enrichment Chord Diagram
The chord diagram is one of the common visualization results of pathway enrichment analysis and is an easy-to-understand connection diagram.
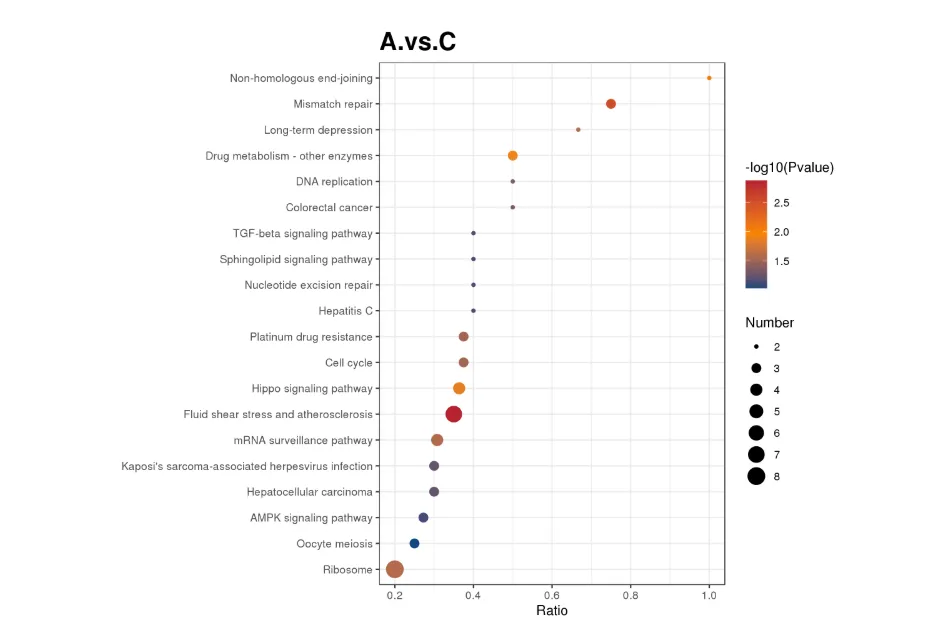
KEGG Enrichment Bubble Plot
The horizontal axis represents the ratio of the number of differential proteins to the total number of proteins identified in the corresponding pathway. A larger value indicates a higher degree of enrichment of differential proteins in the pathway. The color of the dots represents the P-value of the hypergeometric test, with redder colors indicating smaller P-values and greater statistical significance. The size of the dots represents the number of differential proteins in the corresponding pathway; larger dots indicate more differential proteins in the pathway.
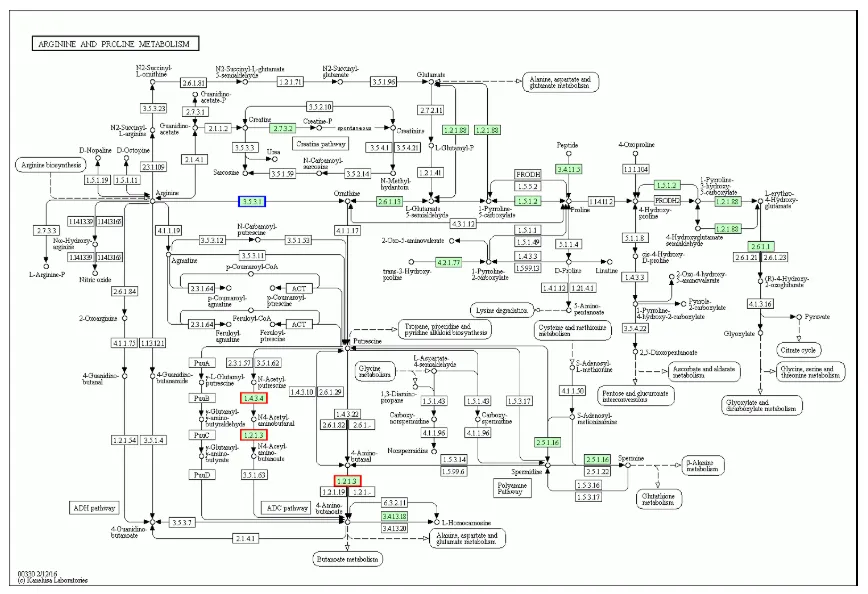
KEGG Enrichment Pathway Map