Introduction to mRNA Sequencing

Messenger RNA sequencing (mRNA-seq) has revolutionized the exploration of cellular functionality, offering researchers unparalleled insights into the transcriptional landscape of cells. By leveraging high-throughput and precise next-generation sequencing (NGS) techniques, RNA-seq unveils gene expression profiles and highlights the dynamic variations within the transcriptome. This innovative technique selectively captures or enriches single-stranded messenger RNAs (mRNAs), converting them into complementary DNA (cDNA) for streamlined library preparation.
At Novogene, we employ cutting-edge Illumina NovaSeq platforms for sequencing cDNA libraries. These platforms utilize a paired-end 150 bp sequencing strategy, providing high-quality short-read data. Leveraging our extensive experience and robust sequencing capacity, Novogene offers a diverse range of services to meet various research objectives. Our offerings extend beyond eukaryotic mRNA sequencing (mRNA-seq). Novogene can also deliver data on prokaryotic transcripts, non-coding RNAs, full-length isoforms (long-reads), whole transcriptomes, and meta-transcriptomes.
Accelerated mRNA Sequencing Solutions: Express & Swift mRNA Sequencing
Building on the success of our standard mRNA Sequencing service, Novogene offers two accelerated solutions designed to propel your research forward without compromising either speed, efficiency, or affordability. Whether you need comprehensive analysis in record time or direct-to-sequencing raw data, we have a queue-free workflow that fits your timeline:
- Swift mRNA Sequencing (5 Business Days): Designed for high-confidence research when timelines drive decisions. For pre-qualified samples, Swift offers a direct-to-sequencing workflow that skips the standard sample QC queue. Reclaim your timeline with Illumina NovaSeq X Plus quality raw FASTQ data in 5 working days.
- Express mRNA Sequencing (7 Business Days): Featuring a fast turnaround time, Express delivers your final report in just 7 business days. It provides the exact same rigorous workflow as our standard service, alongside comprehensive reference-based analysis options including Gene Count, Quantification, and Standard Analysis.
Click Novogene mRNA Sequencing Overview below to compare our Standard, Express, and Swift workflows and discover the service that best fits your needs.
Unlocking the Potential of mRNA Sequencing
Discover the power of mRNA-seq with Novogene’s services, designed to assist in a variety of research goals:
- Explore Diversity: Understand transcript profiles across different tissues, conditions, and treatments.
- Uncover Novel Insights: Identify new transcripts, alternative splicing, and variations for a comprehensive view.
- Navigate Development: Study developmental mechanisms and drug resistance through time-course gene expression.
- Find Biomarkers: Discover potential biomarkers using novel transcripts, SNP/InDel identification, and fusion gene analysis.
- Comprehensive Analysis: Combine transcriptome data with omics analysis for a holistic perspective.
- Clinical Insight: Investigate pathogenic mechanisms and clinical subtypes for precise clinical diagnosis.
Why Choose Novogene for Your mRNA-seq Needs?
- Precision and Efficiency: Benefit from high throughput and accuracy with a remarkable Q30 score of ≥ 85%. Plus, our process requires minimal initial RNA input.
- Proven Expertise: With a rich history of successfully completing thousands of projects, Novogene brings extensive experience to the table. Many researchers have relied on our services to publish in high-impact factor journals.
- Comprehensive Solutions: Novogene provides all-encompassing solutions, covering quantification, differential gene expression, annotation of novel transcripts, alternative splicing, discovery of fusion genes, and exploring potential variations.
- Expert Bioinformatics: Our highly qualified bioinformaticians ensure your data is publication-ready. We use personalized pipelines tailored to species, whether they have a reference genome or not.
Choose Novogene for mRNA-seq that not only meets but exceeds your expectations. Elevate your research with us.
mRNA-seq Specifications: Sample Requirements
| Library Type | Sample Type | Amount | RNA Integrity Number (Agilent 2100) | Purity (NanoDrop) |
| Eukaryotic RNA-Seq (non-stranded library) | Total RNA | ≥ 100 ng | ≥ 4.0, with smooth base line | A260/280 = 1.8-2.2 A260/230 ≥ 1.8 |
| Total RNA (Blood) | ≥ 400 ng | ≥ 5, with smooth base line | ||
| Eukaryotic RNA-Seq (strand specific library) | Total RNA | ≥ 200 ng | ≥ 5, with smooth base line | A260/280 = 1.8-2.2 A260/230 ≥ 1.8 |
| Total RNA (FFPE) | ≥ 200 ng | ≥ 5, with smooth base line | A260/280 = 1.8-2.2 A260/230 ≥ 1.8 |
Note: Sample amounts are listed for reference only. For detailed information, please contact us with your customized requests.
mRNA-seq Specifications: Sequencing and Analysis
| Sequencing Platform | Illumina NovaSeq X-Plus Sequencing Platform |
| Read Length | Paired-end 150 bp |
| Data Output |
|
| Data Analysis Capability |
|
Note: Recommended data outputs and analysis contents displayed are for reference only. For detailed information, please contact us with your customized requests.
Project Workflow of mRNA-seq Services
The project workflow at Novogene for mRNA-seq services begins with Sample Quality Control (Sample QC), ensuring that the provided samples meet the stringent criteria of the RNA-Seq technique. Following this, tailored libraries are meticulously crafted based on the target organism and application, with the library’s quality assessed through Library QC. Subsequently, a 150 bp paired-end sequencing strategy, employing Illumina PE150 technology, captures the essence of the samples. The resulting data undergoes thorough quality checks (Data QC), and our experienced bioinformaticians perform in-depth analyses to extract valuable insights. The culmination of this journey is the delivery of comprehensive, publication-ready results.
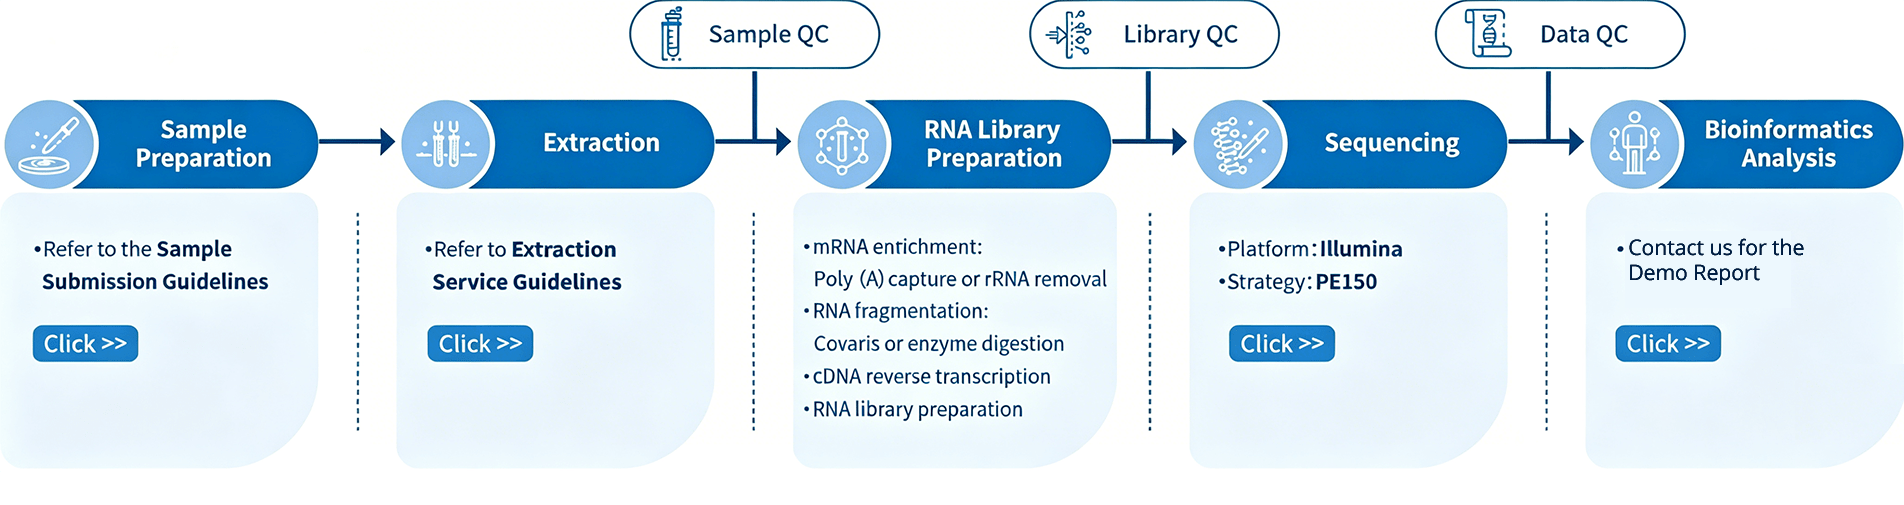
* Swift mRNA Workflow Note: Unlike the standard workflow, the Swift mRNA service omits the Extraction and Sample QC steps. Customers are required to independently perform RNA extraction and quality control, submitting qualified, purified RNA. The project will proceed directly to the Library Preparation stage.
Novogene mRNA Sequencing Overview
| Feature | Standard mRNA Sequencing | Express mRNA Sequencing | Swift mRNA Sequencing |
| Workflow Completion | The same comprehensive, end-to-end solution | Streamlined workflow | |
| Sample QC | Included with strict quality standards | No Sample QC | |
| Library Preparation | Both non-stranded and stranded library | Non-stranded library Only | |
| Sequencing Platform | Illumina NovaSeq X Plus PE150 | ||
| Data Output | Fully customizable based on project needs | ||
| Data Guarantee | SQC pass guarantee available | 80% Data guarantee | |
| Turnaround Time | 9 business days from the confirmation of sample QC | 7 business days from sample receipt | 5 business days from sample receipt |
| Data Analysis | All analysis package available | With Reference-based analysis package available |
FASTQ Only (Data QC) |
| Price | Relatively Lower upfront cost | Competitive pricing for Express service: | Lower upfront cost: |
| Cloud Platform | Free access to NovoMagic for data visualization and analysis | N/A | |
Extensive Experience with FFPE RNA-seq
Compared to poly(A) RNA-Seq, Novogene’s FFPE RNA-seq workflow is superior on multiple aspects of data quality metrics with higher percentage of clean data, lower error rate, higher Q30 and lower percentage of rRNA reads.
We have analyzed hundreds of FFPE samples with this RNA-Seq assay. Table 1 provides an example of the data quality metrics from those analyses.
Table 1. Examples of data quality metrics from FFPE samples analysed with this assay.
| Sample ID | Total Exonic Mapping Rate (%) | Clean Data (%) | Error Rate (%) | Q30 (%) | rNDA (%) |
| 1 | 86.01 | 99.61 | 0.02 | 95.16 | 0.09 |
| 2 | 85.55 | 99.33 | 0.02 | 94.6 | 0.13 |
| 3 | 85.45 | 99.25 | 0.02 | 94.24 | 0.15 |
| 4 | 85.32 | 99.48 | 0.02 | 95.53 | 0.03 |
| 5 | 85.06 | 96.94 | 0.02 | 96.78 | 0.06 |
| 6 | 84.76 | 96.56 | 0.02 | 96.84 | 0.03 |
| 7 | 84.76 | 99.35 | 0.02 | 95.01 | 0.09 |
| 8 | 84.74 | 99.34 | 0.02 | 94.81 | 0.05 |
| 9 | 84.16 | 96.61 | 0.02 | 96.84 | 0.07 |
| 10 | 84.09 | 96.62 | 0.02 | 96.88 | 0.03 |
Featured Publications using Novogene’s RNA-seq service
RNA-seq (mRNA-seq) is the most frequently cited NGS method. Here we have summarized some outstanding academic publications that used Novogene RNA sequencing (mRNA Sequencing) services.
-
DNA hypomethylation silences anti-tumor immune genes in early prostate cancer and CTCs
Journal: CellIssue date: 2023.6IF: 64.5DOI: 10.1016/j.cell.2023.05.028
-
Journal: Nature MedicineIssue Date: 2023.5IF: 87.24DOI: 10.1038/s41591-023-02363-y
-
Cell Death & DifferentiationIssue Date: 2021.2IF: 10.717DOI: 10.1038/s41418-021-00749-4
-
Stem Cells Translational MedicineIssue Date: 2021.1IF: 11.5DOI: 10.1002/sctm.20-0468
-
Journal of Hazardous MaterialsIssue Date: 2020.12IF: 9.038DOI: 10.1016/j.jhazmat.2020.124867
-
Genome MedicineIssue Date: 2020.11IF: 10.675DOI: 10.1186/s13073-020-00796-5
-
Advanced scienceIssue Date: 2020.3IF: 15.84DOI: 10.1002/advs.202000398
Error Rate Distribution
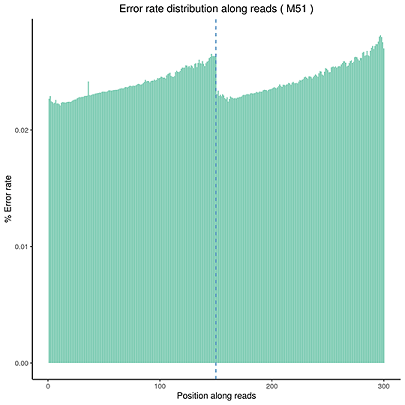
The x-axis shows the base position along each sequencing read and the y-axis shows the base error rate.
GC Content Distribution
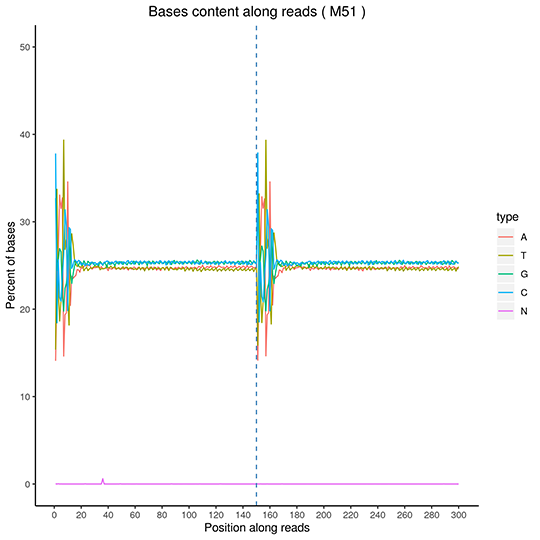
The x-axis for reads position, the y-axis for single base percentage. Different color for different base type.
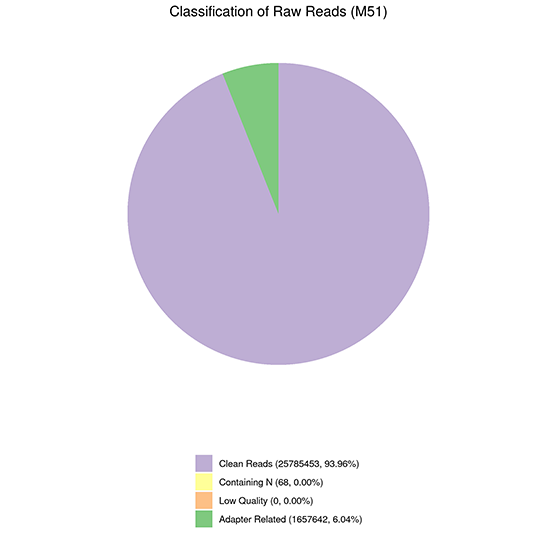
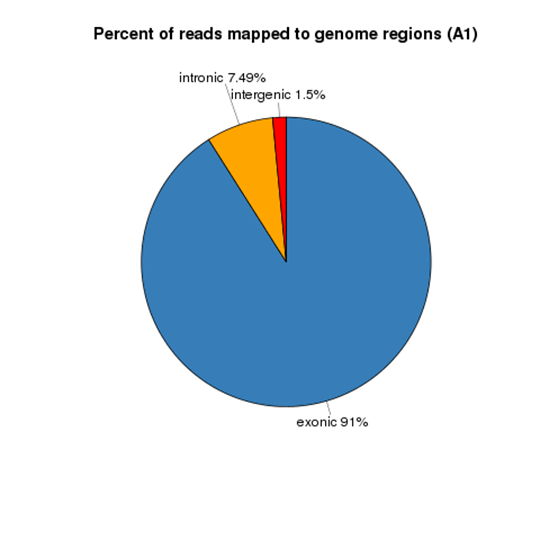
Classification of Raw Reads
Reads Distribution on Reference Genome
Gene Expression Quantification
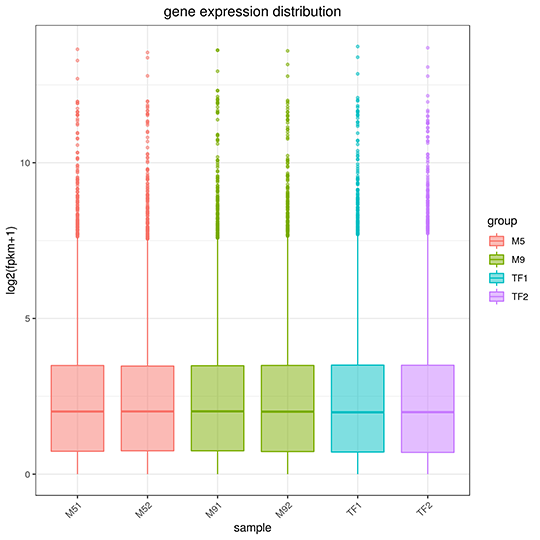
The x-axis represents the name of sample, the y-axis indicates the log10(FPKM+1), parameters of box plots are indicated, including maximum, upper quartile, mid-value, lower quartile and minimum.
Volcano Plot of changes on Gene Expression
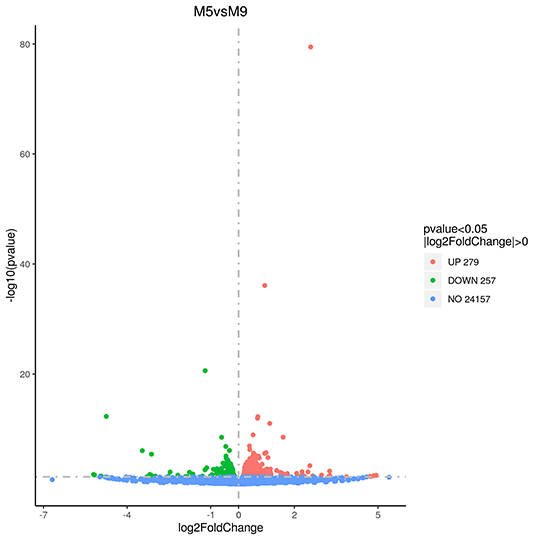
The x-axis shows the fold change of genes in different samples. The y-axis shows the statistically significant degree of changes in gene expression levels. The smaller the corrected pvalue, the bigger -log10(corrected pvalue), the more significant the difference. The points represent genes, blue dots indicate no significant difference in gene expression, red dots indicate upregulated differentially expressed genes, green dots indicate downregulated differentially expressed genes.
Hierarchical Clustering Heatmap of Differential Expression
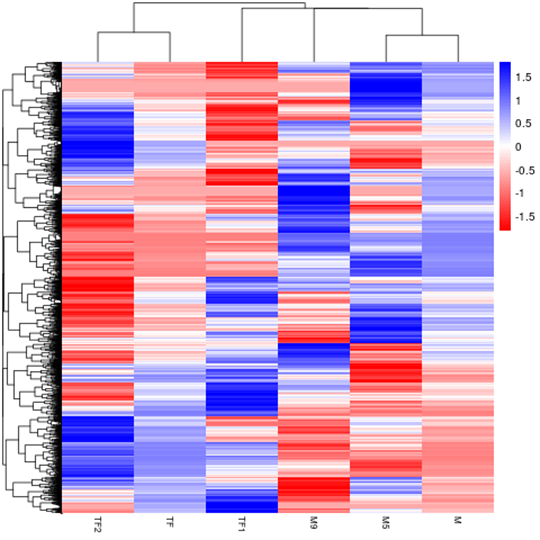
The overall results of FPKM cluster analysis, clustered using the log10(FPKM+1) value. Red denotes genes with high expression levels, and blue denotes genes with low expression levels. The color ranging from red to blue indicates log10(FPKM+1) value from large to small.