Introduction to Prokaryotic RNA Sequencing
Prokaryotic RNA sequencing utilizes next-generation high-throughput sequencing (NGS) technology to sequence the prokaryotic transcriptome and quickly and systematically procure data of all transcripts (coding and non-coding mRNA).
Prokaryotic RNA sequencing profiles the transcriptome through a stranded RNA library, delivering a more accurate estimation of transcript expression.
Application of Prokaryotic RNA Sequencing
- Profiling transcripts in prokaryotes
- Predicting operon, TSS, promoter, and UTR
- Exploring RNA regulation mechanism through antisense transcripts prediction and sRNA analysis
Benefits of Novogene Prokaryotic RNA Sequencing
- Novogene adopted rRNA depletion methods for the construction of prokaryotic RNA libraries. Effective depletion methods were adopted for a variety of species.
- Besides gene expression quantification, multiple gene structure and gene function analysis are included in the standard analysis. Customized analyses can also be devised for prokaryotic RNA sequencing.
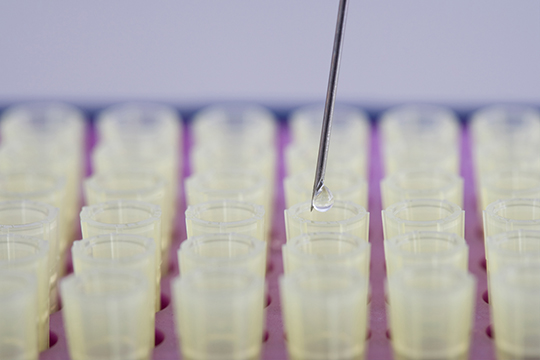
Prokaryotic RNA-seq Specifications: RNA Sample Requirements
| Library Type | Sample Type | Amount | RNA Integrity Number (Agilent 2100) |
Purity (NanoDrop) |
| Prokaryotic RNA Library | Total RNA | ≥ 500 ng | ≥ 6.0, smooth base line | A260/280 ≥ 2.0;
A260/230 ≥ 2.0 |
Prokaryotic RNA -seq Specifications:Sequencing and Analysis
| Sequencing Platform | Illumina Sequencing System |
| Read Length | Paired-end 150bp |
| Recommended Data Amount | ≥ 2Gb raw data per sample for the species with reference genome |
| Content of Data Analysis |
|
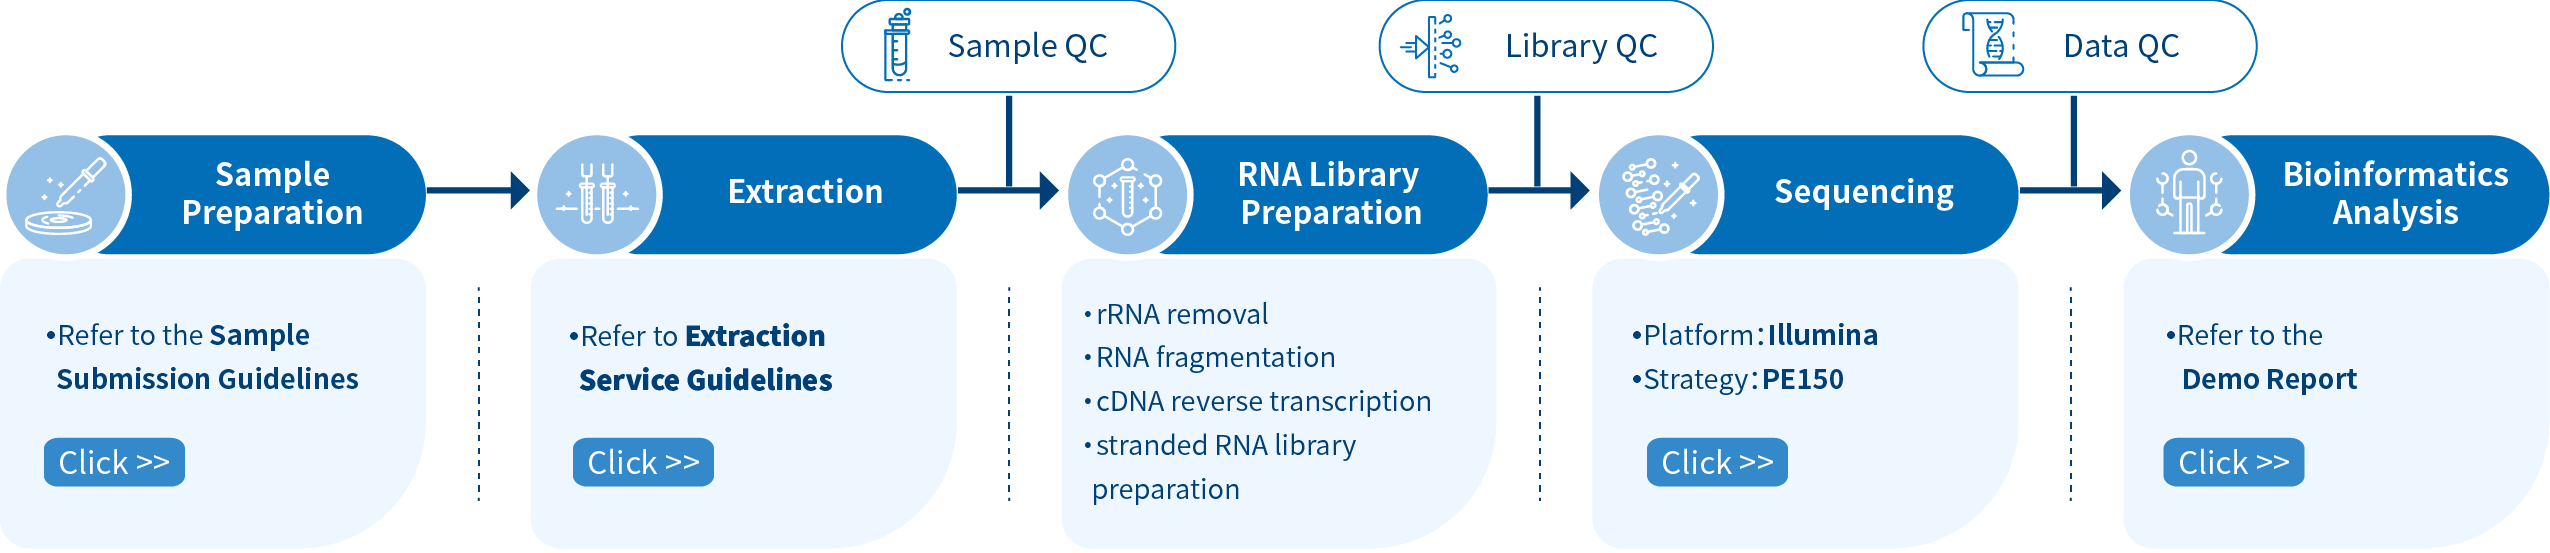
Novogene Workflow of Prokaryotic RNA -seq Service
The first step of the project workflow includes sample quality control (Sample QC) to ensure that your samples meet the criteria of the RNA-Seq technique. Then, an appropriate library is constructed according to your target organism and subsequently tested for its quality (Library QC). Next, a paired-end 150 bp sequencing strategy is used to sequence the samples, and the resulting data goes through quality data control (Data QC) to guarantee the quality of the resulting data. Finally, bioinformatic analyses are performed and publication-ready results are provided. The following flowsheet elaborates the step-by-step protocol.
Distributions of gene expression levels
To compare gene expression levels under different conditions, gene expression level and FPKM distribution among different samples are displayed.
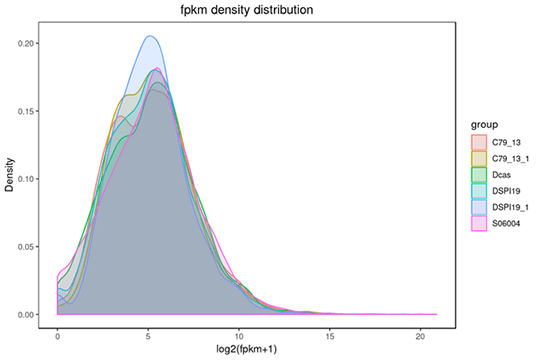
Note:
The figure reveals the FPKM density distribution. The x-axis shows the log10(FPKM+1) and the y-axis describes the gene density
Volcano plot for differentially expressed genes
Volcano plots are used to infer the overall distribution of differentially expressed genes.
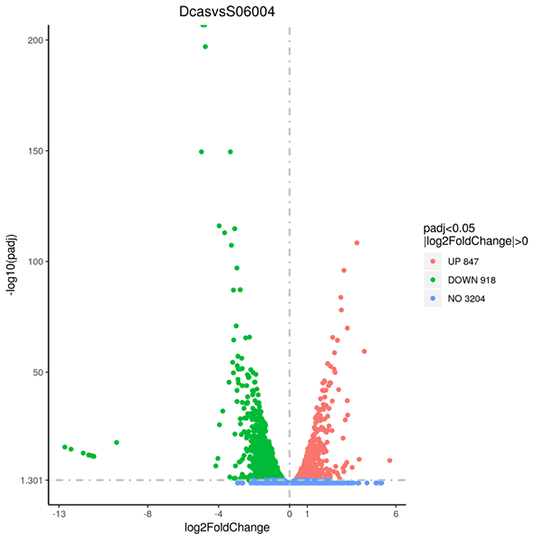
Note:
Red, and green shows significantly up-, and down-regulated genes, respectively. Blue indicates no significance.
UTR length distributions
The 5′ and 3′ UTR sequences are extracted based on the start and end positions of both transcription and translation. The length distributions of both 5′ and 3′ UTR sequences are plotted, respectively.
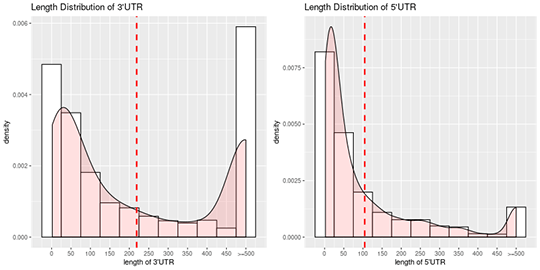
Note:
The x-axis shows the length intervals of UTRs, and the y-axis shows densities of UTRs in different length intervals. The dotted red line describes the averaged length.
*Please contact us to get the full demo report.