Research Services
Novogene aims at providing optimal solutions to meet our customers’ diverse research goals. With the aid of large-scale sequencing platforms (Illumina, PacBio, Nanopore and 10x Genomics) and a professional bioinformatics team, Novogene is capable of delivering high-quality Next Generation Sequencing (NGS) services including:


Technology
Sequencing Platform
-
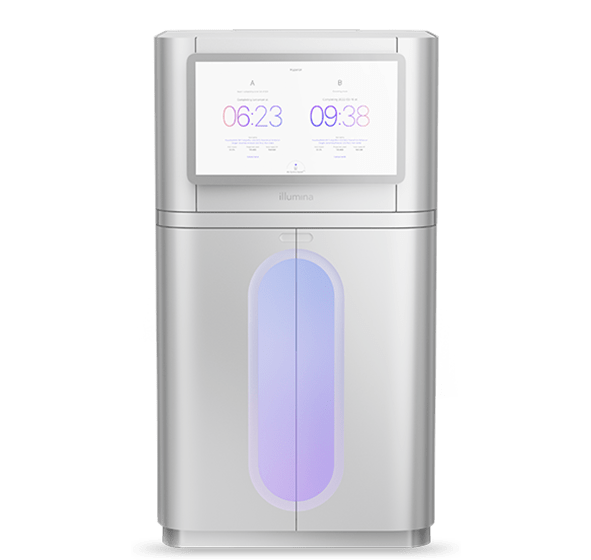
ILLUMINA
NovaSeq X Plus
System specifications:3Tb - 16 Tb output range per run, 20 - 52 billion paired end reads per run, 10B and 25B flowcell available, unmatched precision
-
ILLUMINA
NovaSeq 6000
System specifications:80Gb - 6Tb output range, 1.6 - 40 B paired end reads per run, and PE150, PE250, PE50, etc.c
-
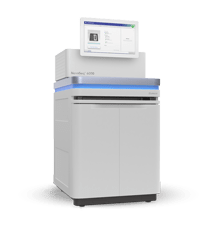
PACBIO
PacBio Revio System
System specifications:N50>15kb, 90% of bases ≥Q30, 90Gb HiFi yield / SMRT Cell, 360Gb HiFi yield / run, 24-hour run times etc.
-
PacBio
PacBio Sequel II/IIe System
System specifications:N50>15kb, read lengths up to 25kb (CCS), >99.999% (QV50) consensus accuracy, even coverage across high-GC/repeat regions and base modifications detection. Direct access to HiFi reads for PacBio Sequel IIe only
-
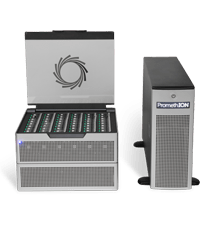
Nanopore
Nanopore PromethION
System specifications:Ultra-long reads up to 2Mb, high yields for large genomes, REAL real-time and accessible for flexible budgets.