Introduction to Human Whole Genome Sequencing

Human whole genome sequencing (hWGS) enables researchers to describe the full genetic composition of individuals and characterize entire human genomes. It allows the identification of genomic variation information, including single-nucleotide polymorphisms (SNPs), insertions and deletions (InDels), structural variations (SVs), and copy number variations (CNVs) in a single and cost-efficient assay.
With extensive experience and well-developed bioinformatics know-how, Novogene delivers high-quality data, publication-ready analysis figures, and personalized results to meet different research objectives and customer needs. Novogene offers ultra-fast turnaround time, even for large projects: equipped with numerous Illumina NovaSeq X Plus /NovaSeq6000 platforms, Oxford Nanopore PromethION and PacBio Revio/Sequel II system.
Novogene is capable of sequencing up to 200,000 human genomes per year at a competitive cost. Novogene hWGS service can provide data across a broad range of applications, including studies on genetic diseases, cancers, pathogenesis mechanisms, or population genetics. Multiple DNA sequencing technologies available at Novogene can identify the highly polymorphic and highly repetitive regions within the genome of interest, thereby providing a complete and accurate human genome characterization [1].
Applications of Human Whole Genome Sequencing
Human genome sequencing has been assisting researchers in the following research areas:
- Genetic diseases
- Cancers
- Pathogenesis mechanisms
- Human population origins
Benefits of Novogene Human Whole Genome Sequencing
- High-quality data to cover whole human genomes for documentation of SNPs, InDels, SVs, and CNVs.
- Efficient discovery of repeated sequences through third-generation sequencing long-reads technology.
- Cost-effective strategy, low-pass sequencing, and imputation services for genome-wide association studies (GWAS) that are available for large cohorts or in complex disease research.
- Professional bioinformatics pipeline and internationally recognized, best-in-class softwares to provide customers with reliable and publication-ready data.


hWGS Specifications: DNA Sample Requirements
| Platform Type | Sample Type | Amount (Qubit®) | Purity |
|
Illumina
NovaSeq X Plus /NovaSeq6000 |
Genomic DNA | ≥ 200 ng |
A260/280=1.8-2.0;
no degradation,
no contamination |
| Genomic DNA (PCR free) |
≥ 1.1 μg | ||
| Genomic DNA from FFPE tissue |
≥ 400 ng | Fragments should be ≥ 1500 bp | |
| PacBio Revio DNA HiFi library | HMW Genomic DNA | ≥ 3 μg | A260/280=1.75-2.0; A260/230=1.5-2.6; *NC/QC=1.0-2.2 Fragments should be ≥ 30 kb |
| PacBio PCR product library |
PCR product | ≥ 2 μg | OD260/280=1.75~2.0; OD260/230=1.4~2.6; *NC/QC=0.95~3.00; Single band (PacBio library fragments distributed above 1k) |
| Nanopore PromethION DNA library |
HMW Genomic DNA | ≥ 8 μg | A260/280=1.75-2.0; A260/230=1.4-2.6; *NC/QC=0.95~3.00 Fragments should be ≥ 30 kb |
| Nanopore Ultra-long DNA Library | uHMW Genomic DNA (blood and cells) | ≥ 30 μg | OD260/280=1.7-2.0; OD260/230=1.3-2.6; *NC/QC=0.95-3.00; Fragments should be ≥ 300K, no fragments below 30k. |
| Nanopore PCR product library |
PCR product | ≥ 2 μg | OD260/280=1.75~2.0; OD260/230=1.4~2.6; *NC/QC=0.95~3.00; Single band |
*NC/QC: NanoDrop concentration/Qubit concentration
hWGS Specifications: Sequencing and Analysis
| Platform Type | Illumina NovaSeq X Plus /NovaSeq6000 | PacBio Revio/sequel II/sequel IIe | Nanopore PromethION |
| Read Length | Paired-end 150 bp | > 15 kb (Average) |
> 17 kb (Average) |
|
Sequencing Depth
|
For rare diseases: 30-50× |
For genetic diseases: 10-20× |
For genetic diseases: 10-20× |
| For tumor tissues: 50×; For adjacent normal tissues and blood: 30× |
For tumor tissues: ≥20× |
For tumor tissues: ≥20× |
|
|
Standard Data
Analysis |
|
|
|
Note: Values of sequencing depths are only listed for your reference. Download the Service Specifications to learn more. For detailed information, please contact us for your customized requests.
Project Workflow of Novogene hWGS Services
From sample preparation, library preparation, DNA sequencing and data quality control, to bioinformatics analysis, Novogene provides high-quality products and professional services. Each step is performed in agreement with a high scientific standard and meticulous design to ensure high-quality research results.
[1] https://www.genome.gov/about-genomics/fact-sheets/Sequencing-Human-Genome-cost
Publications of Human Whole Genome Sequencing
Human whole-genome sequencing (WGS) allows researchers to identify inherited disorders, characterize mutations that drive cancer progression, track disease outbreaks, and achieve many other research goals. Here we have summarized some outstanding academic publications that have been using novogene hWGS services.

-
Journal: JAMA CardiologyIssue Date: April 1, 2020IF: 12.794DOI: 10.1001/jamacardio.2020.0479
-
A genomic and epigenomic atlas of prostate cancer in Asian populations
Journal: NatureIssue date: March 25, 2020IF: 12.794DOI: 10.1038/s41586-020-2135-x
-
Journal: Journal of HepatologyIssue date: DECEMBER 01, 2019IF:20.582DOI: 10.1016/j.jhep.2019.07.014
-
Germline BMP9 mutation causes idiopathic pulmonary arterial hypertension
Journal: European Respiratory JournalIssue date: November 29,2019IF: 12.339DOI: 10.1183/13993003.01609-2018
-
Proteomics identifies new therapeutic targets of early-stage hepatocellular carcinoma
Journal: NatureIssue date: February 27,2019IF: 42.778DOI: 10.1038/s41586-019-0987-8
-
Mutational landscape of secondary glioblastoma guides MET-targeted trial in brain tumor
Journal: CellIssue date: October 18, 2018IF: 38.637DOI: 10.1016/j.cell.2018.09.038
-
Journal: Proceedings of the National Academy of SciencesIssue date: February 5, 2018; IF: 9.412DOI: 10.1073/pnas.1715554115
Data Quality Control
Sequencing Error Rate Distribution
The sequencing error rate is the major confounding factor of precise detection of low-frequency variations by deep sequencing. It determines the quality of the sequencing data. The sequencing error rate is highly associated with the sequencing cycle, escalating towards the end of each read because of the consumption of chemical reagents, which is a common feature of the Illumina high throughput sequencing platform.
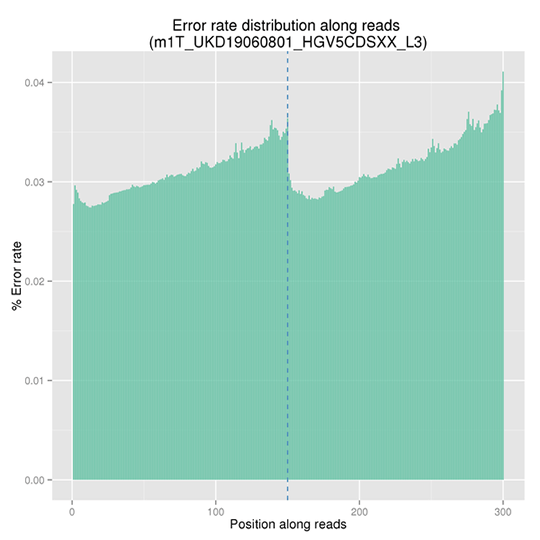
Note: The x-axis represents position in reads, and the y-axis represents the average error rate of bases of all reads at a position.
GC Content Distribution
GC content distribution aims to check the potential of AT/GC separation. Sample contamination, sequencing bias, and errors during library preparation can impact on the sequencing results.
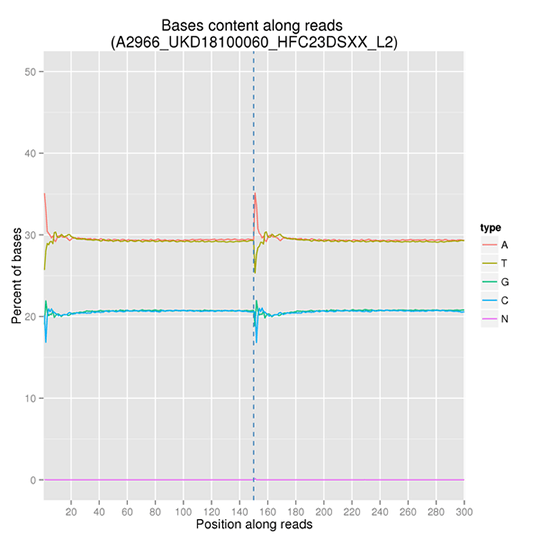
Note: The x-axis is position in reads, and the y-axis is percentage of each type of bases (A, T, G, C); different bases are distinguishable by different colors.
Alignment to Reference Genome
Sequencing Depth & Coverage Distribution
Sequencing depth and coverage illustrate the average number of pair-end clean reads which are aligned to the known reference nucleotides. The sequencing coverage distribution determines whether the identification of variations can be done with a certain degree of confidence at specific base positions.
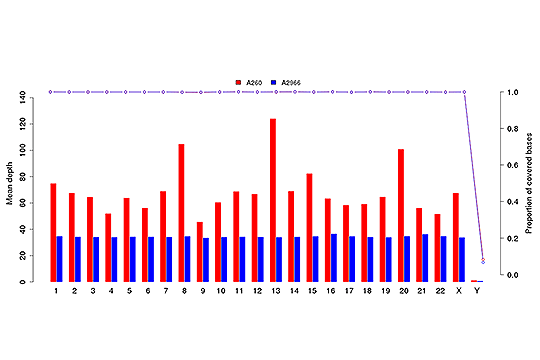
Average sequencing depth (bar plot) and coverage (dot-line plot) in each chromosome.
Note: The x-axis represents chromosome;the left y-axis is the average depth; the right y-axis is the coverage (proportion of covered bases).
SNP/InDel/SV/CNV Calling
Single nucleotide polymorphisms (SNPs), also known as single nucleotide variants (SNVs), constitute the largest class of genetic variants in the genome. Another class of genetic variations includes small insertions and deletions (InDels) which are <50 bp in length. The InDels present in the coding region or splicing sites may cause changes in mRNA transcripts and proteins.
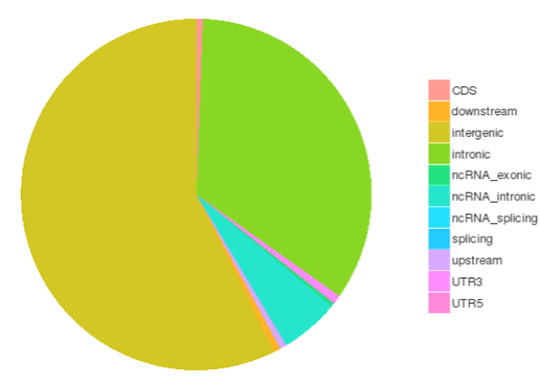
The number of SNPs/InDels in various genomic regions
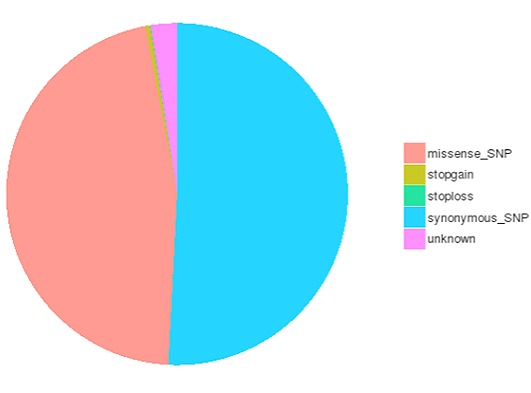
The number of different types of SNPs/InDels in the coding region
Structural variants (SVs) are genetic variants with relatively larger sizes (>50 bp), and they include deletions, duplications, insertions, inversions, and translocations. SVs form the underlying genetic basis of individual differences and have potential effects on the disease and cancer susceptibility.
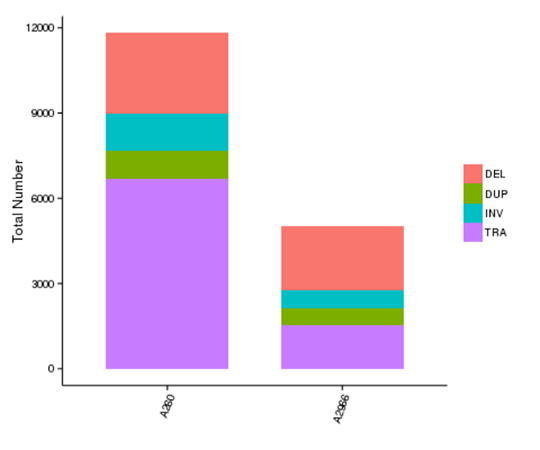
The number of different types of SV in each sample
Note: The x-axis represents samples, and the y-axis indicates the number of each type of SV.
Copy number variants (CNVs) are genetic variants that lead to variations in copy number of relatively larger fragments (longer than 50 bp) among individuals. There are two types of CNVs, i.e. gain and loss of copies. CNVs may form the underlying genetic basis of individual differences and cancers.
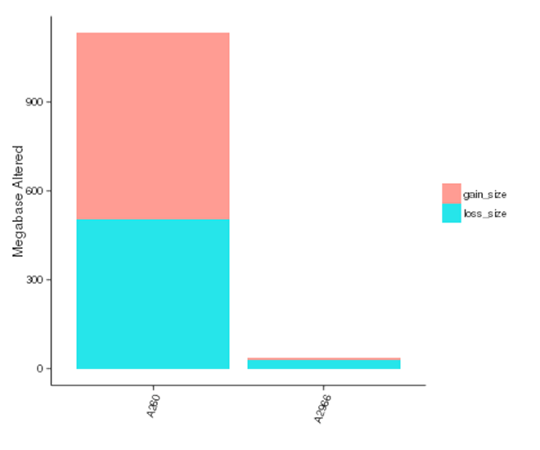
The size of genomic regions affected by CNVs in each sample
Note:The x-axis represents samples name, and the y-axis indicates the total size of genomic regions affected by gain or loss (Mb)
Advanced Analysis
Driver Gene Analysis
Heatmap of Significantly Mutated Genes
Only a few mutations related to cancer can drive tumorigenesis by affecting genes. Significantly mutated genes (SMGs) refer to those mutations that show a significantly higher mutation rate than the background mutation rate (BMR), thus indicating a positive selection during tumorigenesis. Analysis of SMGs helps us pinpoint the key genes that are critical for cancer initiation and progression.
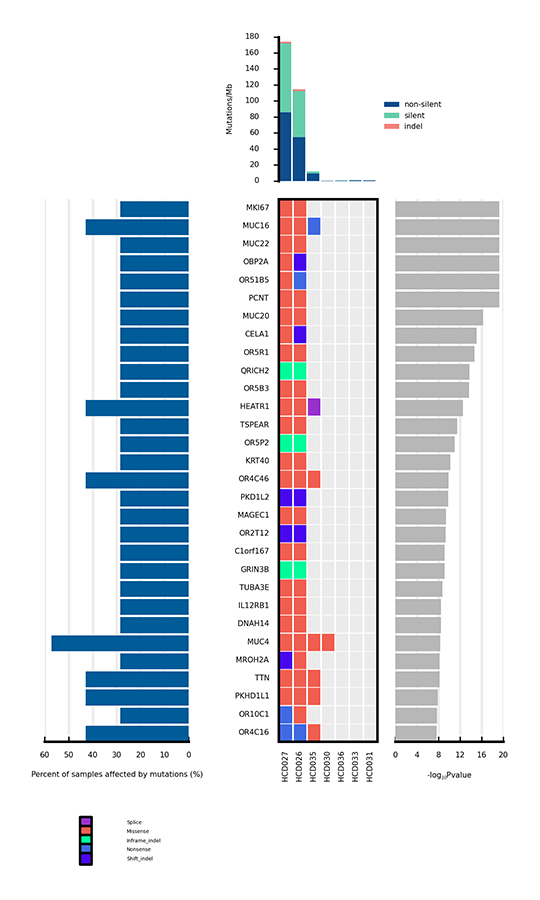
Heatmap of significantly mutated genes (SMGs) across samples
Note:
The bar plot at the top shows the mutation rate of each sample (Mutations/Mb). The heatmap in the center shows the types of mutations of each SMG across samples. The horizontal axis represents samples, and the vertical axis represents SMGs. Different types of mutations are distinguished by different colors. The bar plot on the left side of the heatmap shows the percentage of samples affected by mutations in each SMG, and the plot on the right side shows p values of SMGs.
Tumor Heterogeneity Analysis
Intra-tumor Heterogeneity Analysis
Intra-tumor heterogeneity refers to the heterogeneous composition of tumor cells. Deciphering the intra-tumor heterogeneity and clonal architecture may contribute towards the understanding of therapeutic resistance.
The number and content (subclonal somatic mutations) of tumor subclones were identified by analyzing the variant allele frequencies of somatic mutations.
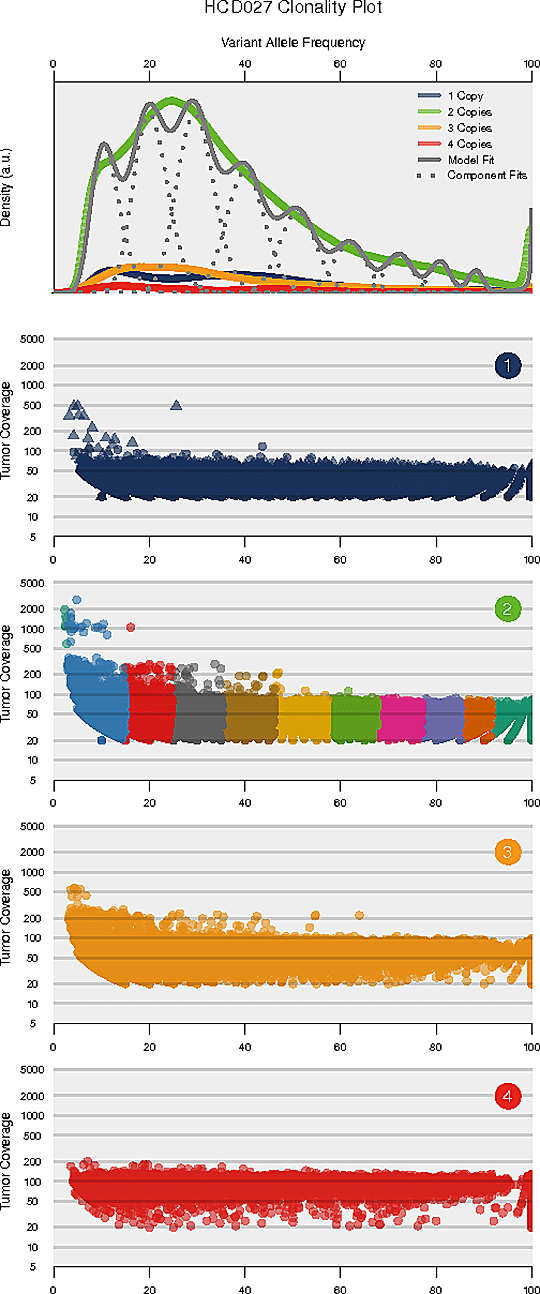
Inferred clonal architecture
Note:
The horizontal axis of each panel represents variant allele frequency (VAF). A cluster of mutations with relatively low VAF represents a subclonal population. The top panel shows kernel density of VAFs across regions with copy number one, two, or three, posterior predictive densities summed over all clusters for copy number neutral variants, and posterior densities for each cluster/component. The panels below the top panel show read depth versus VAFs for each class of copy number regions.
*Please contact us to get the full demo report.