Whole Genome Sequencing
Whole Genome Sequencing (WGS) refers to the process of determining the complete DNA sequence of an organism’s genome. This method provides a detailed analysis of both coding and non-coding regions, enabling comprehensive insights into the genetic makeup of humans, animals, plants, and microbial species. By examining the entire genome, WGS identifies a broad spectrum of genetic variations, including single nucleotide polymorphisms (SNPs), insertions and deletions (INDELs), copy number variations (CNVs), and structural variations (SVs). Our sequencing analysis enables the identification of somatic and germline mutations as well as customized patterns of cancers and other diseases.

Technology
Sequencing Platform
-
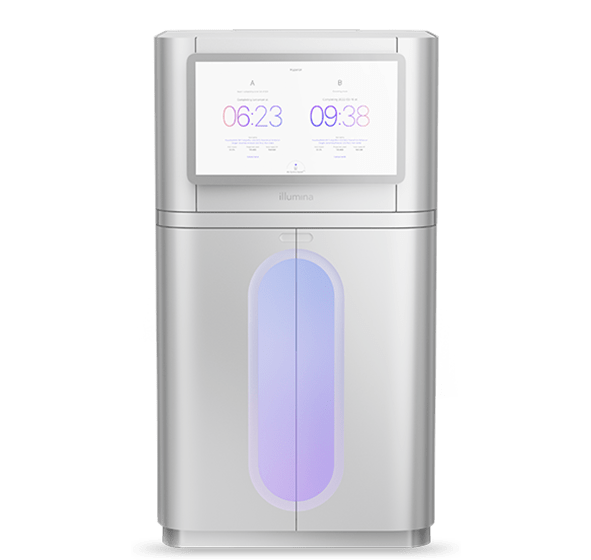
ILLUMINA
NovaSeq 6000
System specifications:80Gb - 6Tb output range, 1.6 - 40 B paired end reads per run, and PE150, PE250, PE50, etc.
-
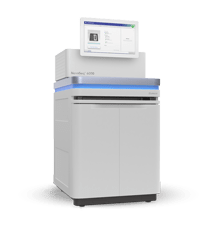
ILLUMINA
NovaSeq X Plus
System specifications:165Gb - 16Tb output range, 3.2 - 52 B paired end reads per run, and PE50, PE100, PE150, etc.c
-
PACBIO
PacBio Revio System
System specifications:N50>15kb, 90% of bases ≥Q30, 90Gb HiFi yield / SMRT Cell, 360Gb HiFi yield / run, 24-hour run times etc.
-
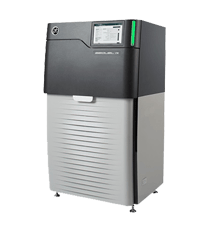
PacBio
PacBio Sequel IIe System
System specifications:N50>15kb, read lengths up to 25kb (CCS), >99.999% (QV50) consensus accuracy, coverage across high-GC/repeat regions.
-
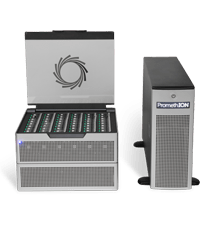
Nanopore
Nanopore PromethION
System specifications:Ultra-long reads up to 2Mb, high yields for large genomes, REAL real-time and accessible for flexible budgets.