Introduction to Human Whole Exome Sequencing

Whole exome sequencing (WES) employs next-generation sequencing technology (NGS), which provides a cost-efficient alternative to whole genome sequencing (WGS). The human whole exome, composed by about 180,000 exons (protein-coding region of the genome) accounts for only 1-2% of the human genome, but up to 85% of the disease-related mutations associated with Mendelian disorders occur in these regions [1]. By targeting these regions, human whole exome sequencing (hWES) provides an in-depth sequencing and analysis approach to indicate genome variants, germline mutations, somatic mutations, and pathogenic mechanisms. hWES service supports a broad range of studies for researchers, including genetic disease-related variants, complex diseases, cancer research, or human population genetics.
Novogene’s hWES service offers a convenient solution with plenty of profits, such as high-quality data, publication-ready results that help you achieve your research goals. Novogene is equipped with clinical-grade sequencing laboratories that are validated and comply with CLIA/CAP/ISO17025 standards, providing precise diagnosis with our clinical whole exome sequencing service.
Applications of Human Whole Exome Sequencing
Human whole exome sequencing has been successfully helping researchers to obtain answers to many different and cutting-edge research and clinical questions:
- Genome variant studies through exon detection
- Pathogenic mechanism and molecular characterization of samples in research and clinical contexts
- Cancer biopsy as a tool
Benefits of Novogene Human Whole Exome Sequencing
- hWES focuses on the exome regions which can help achieve higher sequencing depth with significantly fewer data of good quality, compared with WGS.
- hWES increases the sensitivity of the analysis which makes the detection of rare mutations easy.
- Novogene’s extraordinary professional bioinformatics pipeline and internationally recognized software ensures that our customers always receive reliable and publication-ready data.


hWES Specifications: DNA Sample Requirements
| Platform Type | Sample Type | Amount (Qubit®) | Purity |
| Illumina NovaSeq 6000/llumina NovaSeq X Plus | Genomic DNA | ≥ 300 ng | A260/280 = 1.8-2.0; no degradation,no contamination |
| cfDNA/ctDNA | ≥ 35 ng | Fragments should be in multiples of 170 bp, with no genomic contamination |
|
| Genomic DNA from FFPE tissue | ≥ 400 ng | Fragments should be ≥ 1000 bp |
Note: Values of sample amount are only listed for your reference. Download the Service Specifications to learn more. For detailed information, please contact us with your customized requests.
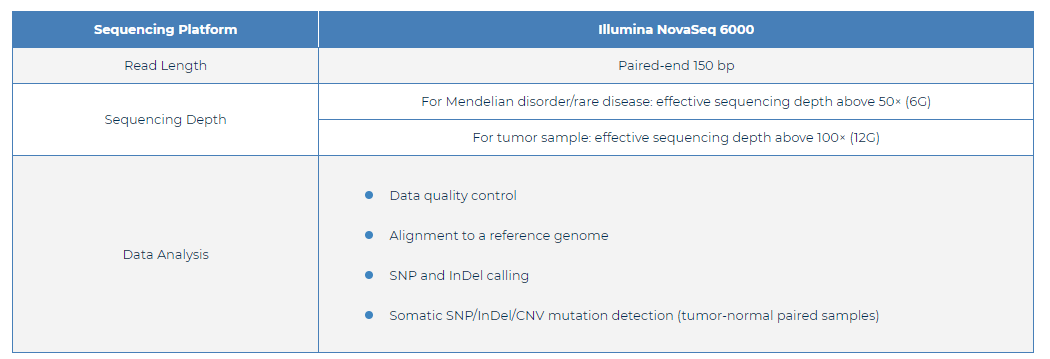
hWES Specifications: Sequencing and Analysis
| Sequencing Platform | Illumina NovaSeq 6000 | |||
| Read Length | Paired-end 150 bp | |||
|
Sequencing Depth
|
For Mendelian disorder/rare disease: effective sequencing depth above 50× (6G) | |||
| For tumor sample: effective sequencing depth above 100× (12G) | ||||
| Data Analysis |
|
|||
Note: Sequencing depths and analysis contents displayed are for your reference only. Download the Service Specifications to learn more. For detailed information, please contact us with your customized requests.
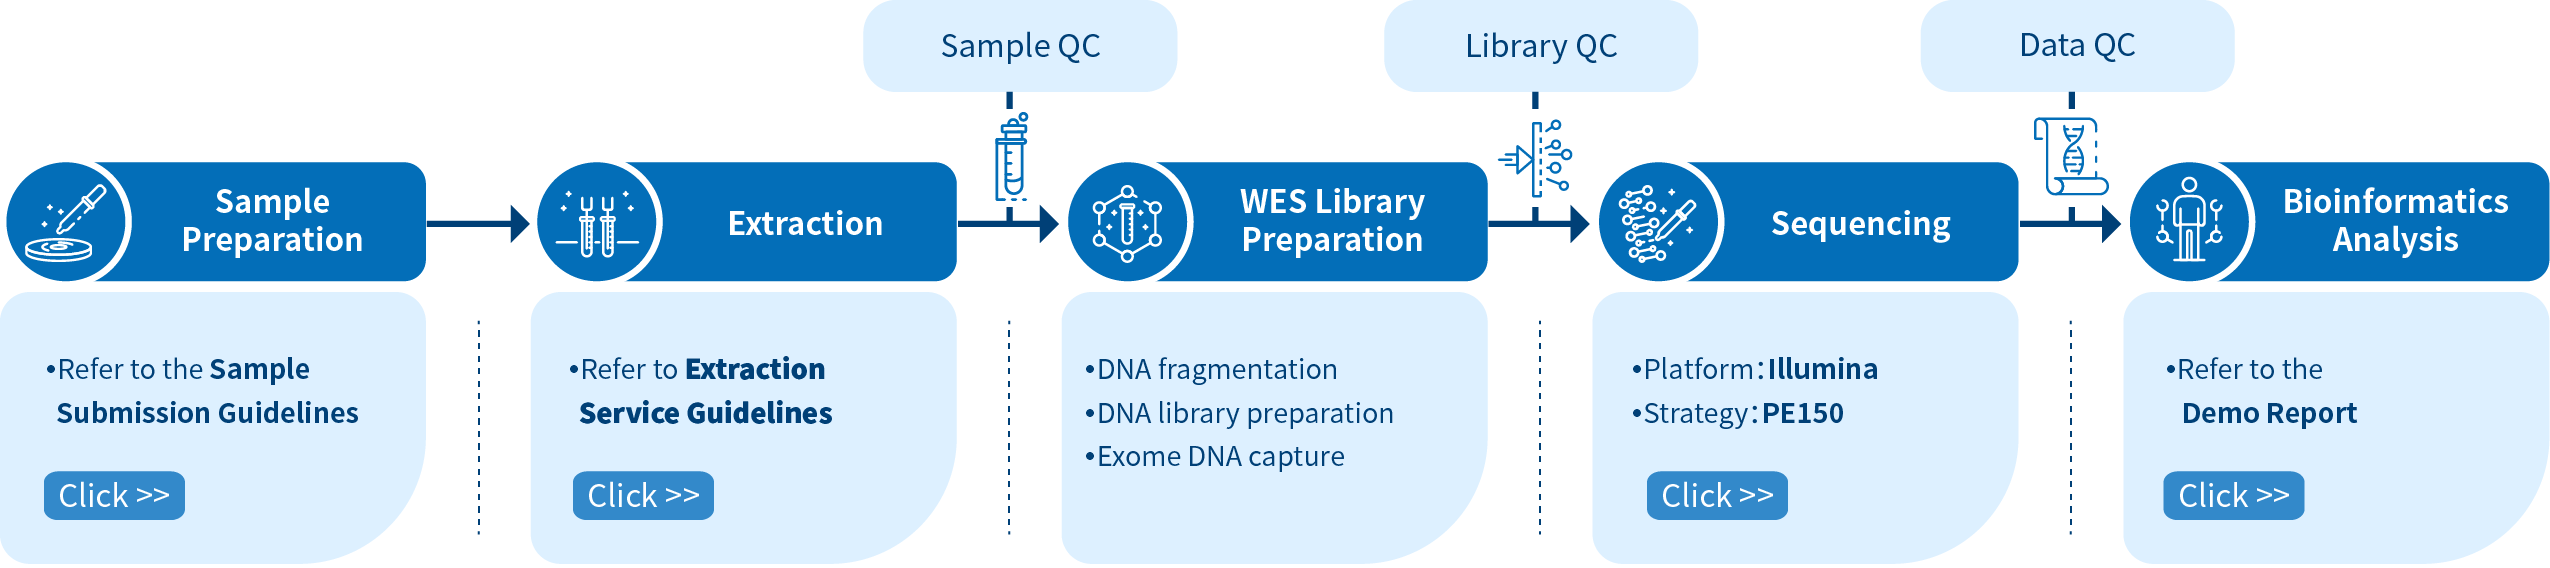
Project Workflow of Novogene hWES Services
From sample preparation, library preparation, DNA sequencing and data quality control, to bioinformatics analysis, Novogene provides high-quality products and professional services. Each step is performed in agreement with a high scientific standard and meticulous design to ensure high-quality research results.
Publications of Human Whole Exome Sequencing
Human whole exome sequencing (hWES) enables researchers to cost-effectively unveil protein-coding variants in rare Mendelian disorders, complex disease, cancer, or human population studies. Here we summarized some outstanding academic publications that have used Novogene hWES services.


-
JAMA CardiologyIssue Date: April 1, 2020IF: 12.794DOI: 10.1001/jamacardio.2020.0479
-
Annals of the Rheumatic DiseasesIssue Date: 2020IF: 16.102DOI: 10.1136/annrheumdis-2019-215533
-
Journal of HepatologyIssue Date: July 23, 2019IF: 20.582DOI: 10.1016/j.jhep.2019.07.014
-
Germline BMP9 mutation causes idiopathic pulmonary arterial hypertension
European Respiratory JournalIssue Date: 2019IF: 12.339DOI: 10.1183/13993003.01609-2018
-
Cancer ResearchIssue Date: 2019IF: 9.727DOI: 10.1158/0008-5472.CAN-18-1086
-
Mutational landscape of secondary glioblastoma guides MET-targeted trial in brain tumor
CellIssue Date: October 18, 2018IF: 38.637DOI: 10.1016/j.cell.2018.09.038
-
Whole-exome sequencing reveals the origin and evolution of hepato-cholangiocarcinoma
Nature CommunicationsIssue Date: 01 March 2018IF: 12.121DOI: 10.1038/s41467-018-03276-y
Data Quality Control
Sequencing Error Rate Distribution
The sequencing error rate is the major confounding factor of precise detection of low-frequency variations by deep sequencing. It determines the quality of the sequencing data. The sequencing error rate is highly associated with the sequencing cycle, escalating towards the end of each read because of the consumption of chemical reagents, which is a common feature of the Illumina high throughput sequencing platform.
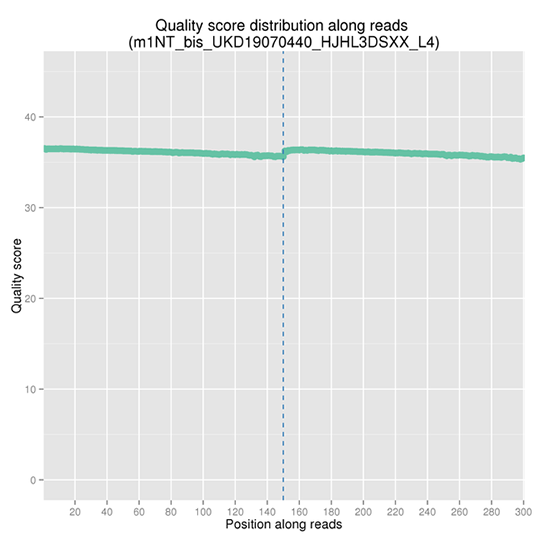
Note: The x-axis represents the position in reads, and the y-axis indicates the average error rate of bases of all reads at a position.
GC Content Distribution
GC content distribution aims to check the potential of AT/GC separation. Sample contamination, sequencing bias, and errors during library preparation can impact on the sequencing results.
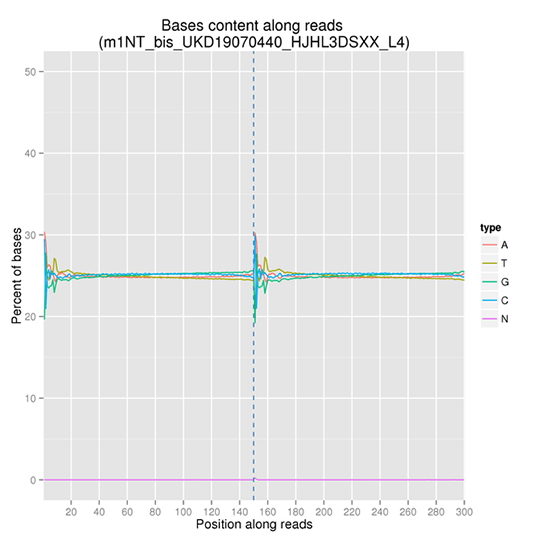
Note: The x-axis represents the position in reads, and the y-axis indicates the percentage of each type of bases (A, T, G, C); different bases can be distinguished by different colors.
Alignment to Reference Genome
Sequencing Depth & Coverage Distribution
Sequencing depth and coverage illustrate the average number of pair-end clean reads which are aligned to the known reference nucleotides. The sequencing coverage distribution determines whether the identification of variations can be done with a certain degree of confidence at specific base positions.
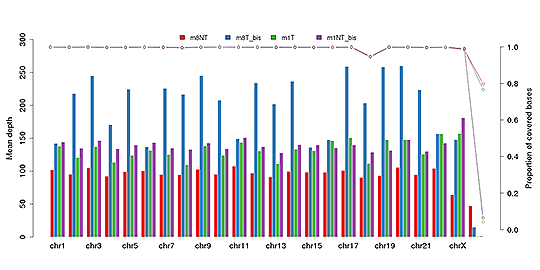
Average sequencing depth (bar plot) and coverage (dot-line plot) in each chromosome
Note: The x-axis represents the chromosome; the left y-axis indicates the average depth; the right y-axis shows the coverage (proportion of covered bases).
SNP and InDel Calling, Annotation and Statistics
Single nucleotide polymorphisms (SNPs), also known as single nucleotide variants (SNVs), constitute the largest class of genetic variants in the genome. Another class of genetic variations includes small insertions and deletions (InDels) which are <50 bp in length. The InDels present in the coding region or splicing sites may cause changes in mRNA transcripts and proteins.
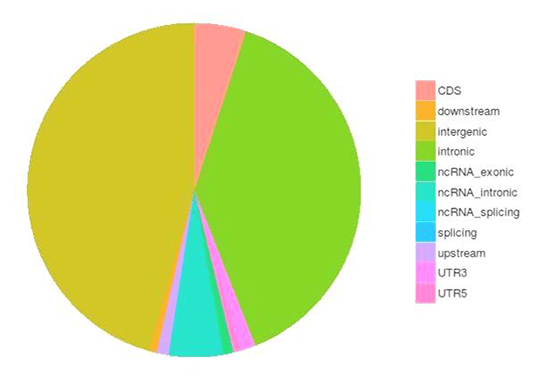
The number of SNPs/inDels in various genomic regions
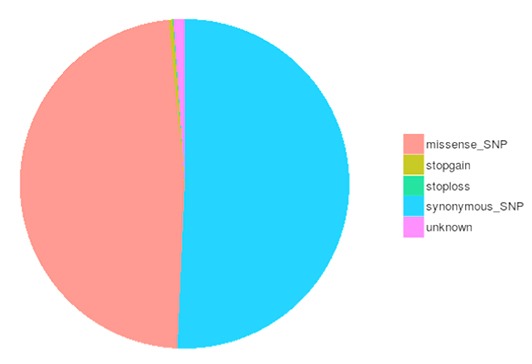
The number of different types of SNPs/InDels in the coding region
Advanced Analysis
Driver Gene Analysis
Heatmap of significantly mutated genes
Only a few mutations related to cancer can drive tumorigenesis by affecting genes. Significantly mutated genes (SMGs) refer to those mutations that show a significantly higher mutation rate than the background mutation rate (BMR), thus indicating a positive selection during tumorigenesis. Analysis of SMGs helps us pinpoint the key genes that are critical for cancer initiation and progression.
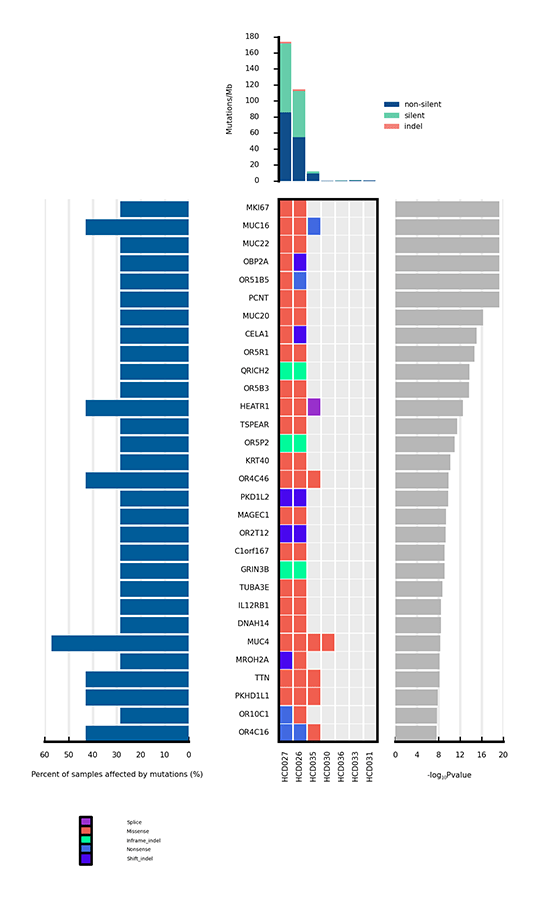
Heatmap of significantly mutated genes (SMGs) across samples
Note:
The bar plot at the top shows the mutation rate of each sample (Mutations/Mb). The heatmap in the center shows the mutation types of each SMG across samples. The horizontal axis represents samples, and the vertical axis represents SMGs. Different mutation types are distinguished by different colors. The bar plot on the left side of the heatmap shows the percentage of samples affected by mutations in each SMG, and the plot on the right side shows p values of SMGs.
Tumor Heterogeneity Analysis
Intra-tumor Heterogeneity Analysis
Intra-tumor heterogeneity refers to the heterogeneous composition of tumor cells. Deciphering the intra-tumor heterogeneity and clonal architecture may contribute towards the understanding of therapeutic resistance.
The number and content (subclonal somatic mutations) of tumor subclones were identified by analyzing the variant allele frequencies of somatic mutations.
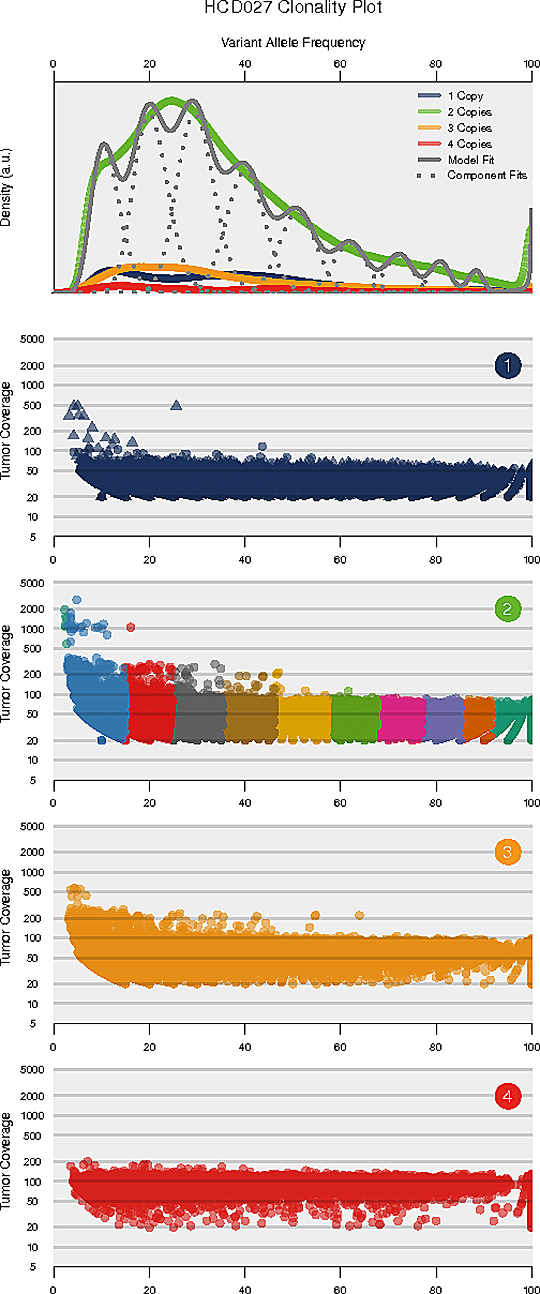
Note:
The horizontal axis of each panel represents variant allele frequency(VAF). A cluster of mutations with relatively low VAF represents a subclonal population. The top panel shows kernel density of VAFs across regions with copy number one, two, or three, posterior predictive densities summed over all clusters for copy number neutral variants, and posterior densities for each cluster/component. The panels below the top panel show read depth versus VAFs for each class of copy number regions.
*Please contact us to get the full demo report.