Introduction to Spatial Transcriptomics


Spatial transcriptomics is a powerful technique that allows researchers to visualize and analyze gene expression patterns at distinct spatial locations within a tissue. By combining transcriptomics with imaging techniques, spatial transcriptomics provides insights into the spatial organization of cells within a tissue as well as their gene expression patterns in various biological contexts. Spatial transcriptomics enables the analysis of spatiotemporal gene expression patterns, inter-cellular interactions, cell differentiation, to name a few.
Novogene’s spatial transcriptomics service is powered by the 10X Genomics’ Visium HD WT Panel Gene Expression, which delivers whole transcriptome spatial gene expression at single-cell resolution, enabling researchers to explore tissues using novel techniques. With no gaps in tissue coverage and 6.5 x 6.5 mm dual capture areas per slide, this new platform brings your FFPE tissue analysis into ultra-high definition. This probe-based gene expression profiling technology from 10X Genomics is designed specifically for FFPE samples and targets approximately 18,000 genes in humans and 20,000 genes in mice, providing information on the whole transcriptome. Novogene also utilizes the Visium CytAssist platform for facilitating the transfer of the transcriptomic probes from the glass slide to a capture area on the Visium slide, thus minimizing mislocalization and maintaining spatiality.
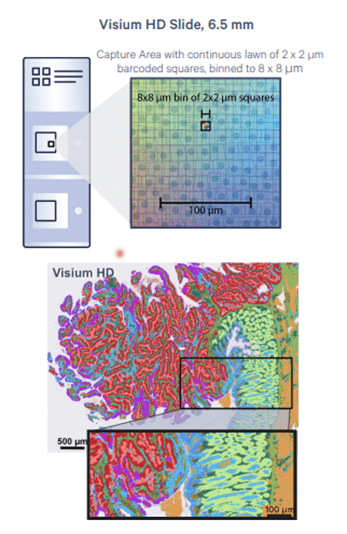
Our end-to-end Visium HD service includes:
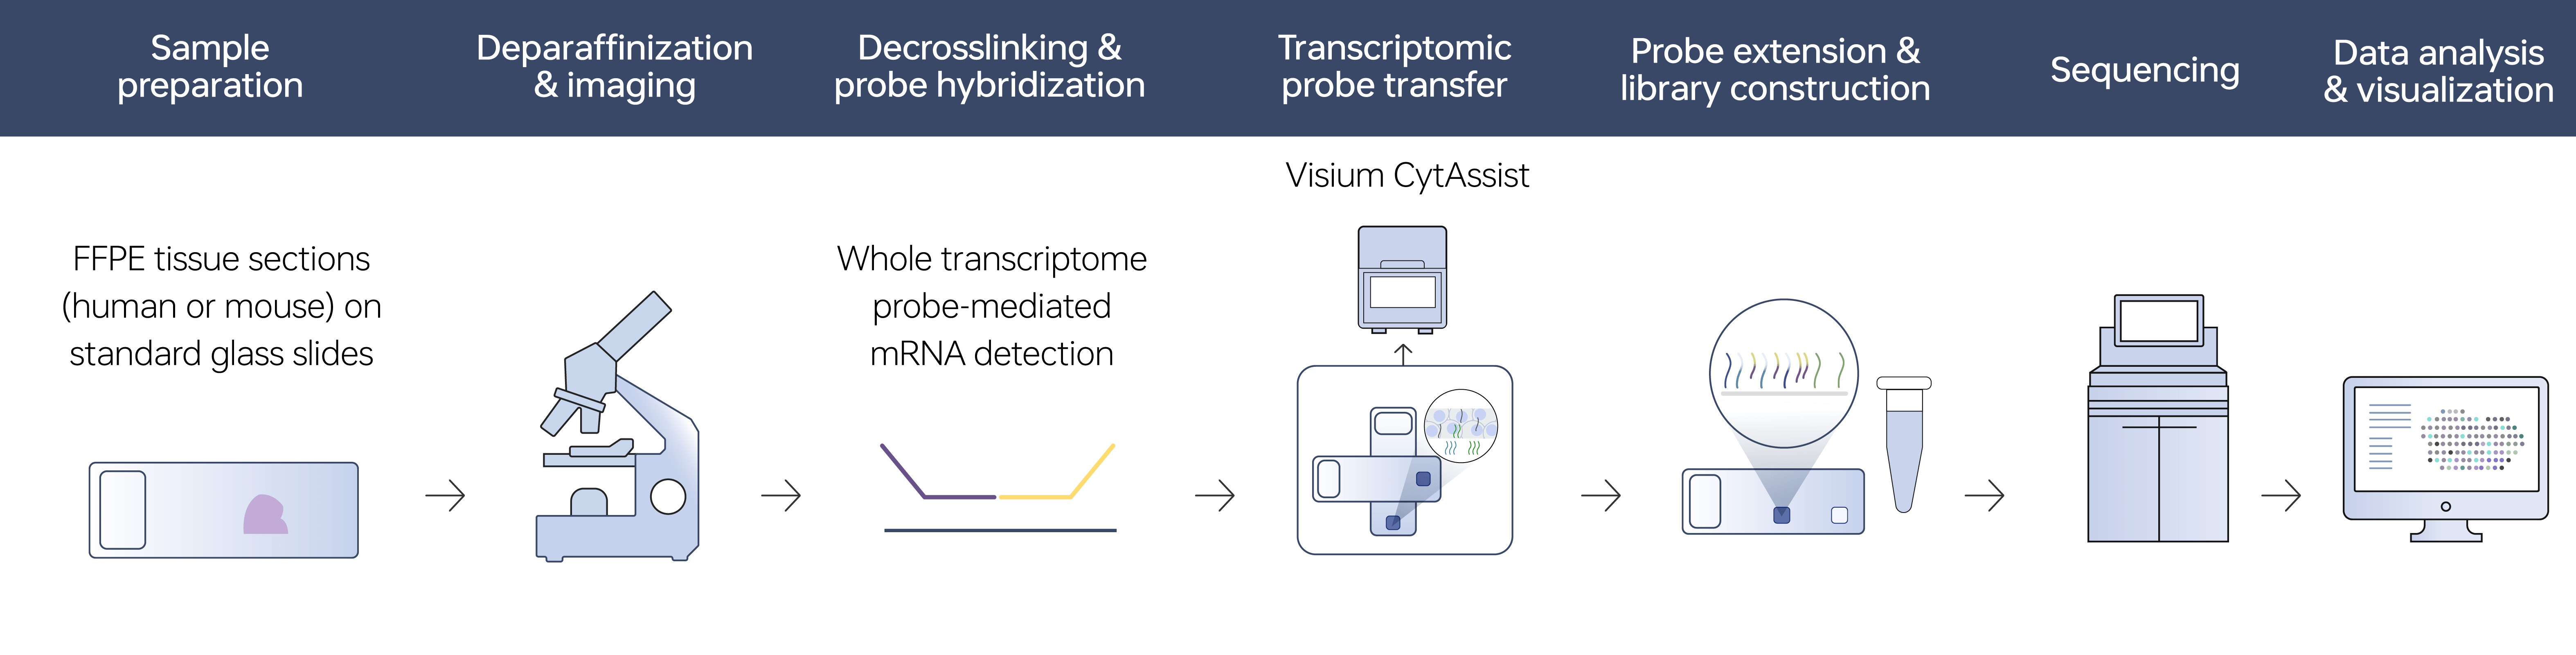
- Sample preparation (tissue sectioning from FFPE blocks)
- Sample QC (Hematoxylin & Eosin staining and imaging, RNA integrity measurement)
- Probe transfer via Visium CytAssist
- Library preparation and sequencing on the Illumina NovaSeq X Plus
- Full data analysis: Space Ranger, Seurat, DEGs, and functional enrichment
Our seamless end-to-end service includes sample QC, sample preparation, staining, imaging, sequencing on the latest Illumina NovaSeq X Plus, and comprehensive data analysis, complete with “publication-ready” images. Spatial transcriptomics using Visium HD has found its applications in several fields, including cancer research, developmental biology, and the neurosciences.
Applications of Spatial Transcriptomics
Spatial transcriptomics has been assisting researchers in the following research areas, including:
- Cancer research
- Developmental biology
- Neuroscience
- Immunology
Benefits of Novogene’s Spatial Transcriptomics Service
- End-to-end service: Our seamless end-to-end service includes sample QC (RNA integrity measurement), sample preparation, H&E staining and imaging, sequencing on the latest Illumina NovaSeq X Plus, and comprehensive data analysis, complete with “publication-ready” images.
- High-Quality Data: We deliver high-quality sequencing data that meets leading industry standards and can be utilized effectively for downstream bioinformatics analysis.
- Bioinformatics Support: We provide comprehensive bioinformatics analysis, complete with ‘publication ready’ figures. Our analysis pipeline is supported by 10X Genomics’ Space Ranger as well as other commonly utilized bioinformatics pipelines such as Seurat analysis.
- Extensive experience: Novogene has experience with offering spatial transcriptomics services for a wide variety of human and mouse tissue types.
- Customer Service System (CSS): Novogene’s Customer Self Service System (CSS) is an online project management portal that streamlines project management and provides direct access to all your sequencing projects in one place. You can view your sequencing project(s), track their progress, access reports, collaborate with your team members, and obtain other useful information at one place.
Sample Requirements
| Service | Species Type | Sample Type | DV200 | Other details |
| Spatial Transcriptomics (10X Genomics Visium HD) |
Human Mouse |
FFPE block/tissue sections |
≥30% |
|
Note: This service is available for human and mouse FFPE samples.
Bioinformatics Analysis
Our comprehensive bioinformatics analysis report is complete with publication ready images. The summary report from 10X Genomics Space Ranger software provides you with quality metrics related to sequencing and mapping. The differential expression analysis report includes analysis results from Space Ranger as well as Seurat Analysis.
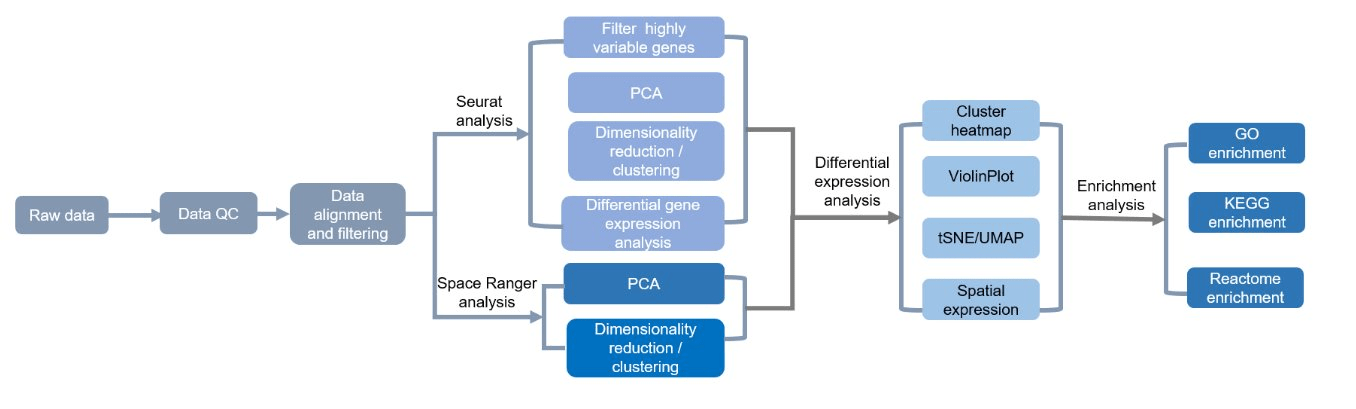
Project Workflow of Novogene Spatial Transcriptomic Services
Our service workflow starts with Sample QC, to ensure high quality sequencing data. We evaluate the RNA integrity in the FFPE samples using DV200. We recommend to proceed to the next steps (shown below) only if the DV200 > 30%.
Supported by
-
Scientific DataIssue Date: 6 January 2024IF: 9.8DOI: 10.1038/s41597-023-02878-6
-
Scientific Data Date: January 2019IF: 5.929DOI: https://www.nature.com/articles/s41597-019-0240-1
Structure and Function annotation
Gene Ontology
The Gene Ontology (GO) project aims to provide reliable descriptions of gene products within several databases. GO vocabularies (ontologies) explain gene products concerning their associated biological processes, molecular functions, and cellular components in a species-independent approach. GO annotation is only available for identified novel genes and isoforms.

Gene Ontology Annotation Classification
Note:
The x-axis shows the three GO categories, and the y-axis shows the number of differential genes annotated to the term (including the sub-term of the term). The three different categories represent the three basic classifications of GO term (from left to right are biological processes, cellular components, and molecular functions);
Structure analysis
CNCI (Coding-Non-Coding Index) is a powerful signature tool to predict the sequences based on the intrinsic composition and offers accurate classification of transcripts assembled from whole-transcriptome sequencing data. PLEK(predictor of long non-coding RNAs and messenger RNAs based on an improved k-mer scheme) is a tool for predicting long non-coding RNAs and mRNAs in the absence of genomic sequences or annotations using a computational pipeline based on an improved k-mer scheme and a support vector machine (SVM) algorithm. The results from PLEK and CNCI are shown in the Venn diagrams.

Venn diagrams of results from PLEK and CNCI
Alternative Splicing

Summary of alternative splicing events
Note:
Alt.3’: Alternative 5′ splice site; Alt.5’:Alternative 3′ splice site
*Please contact us get the full demo report.
