Introduction to Reduced Representation Bisulfite Sequencing (RRBS)


Reduced Representation Bisulfite Sequencing (RRBS) is a technique used to study DNA methylation which focuses on CpG islands and other CpG-rich regions of the genome. Novogene’s method uses the methylation insensitive restriction enzyme MspI which cuts DNA at CpG-rich sites, regions that are the most common sites of methylation in mammalian species. After enriching for CpG rich regions, DNA undergoes bisulfite treatment which converts the unmethylated cytosines to uracil, while methylated cytosines remain unchanged. Subsequently, we sequence the DNA to determine the methylation status of cytosines by comparing treated DNA to the reference genome.
RRBS is considered a cost-effective method for DNA methylation analysis, as it reduces the amount of sequencing data needed by focusing only on regions of interest such as CpG islands, thus making it suitable for large-scale studies. If you are interested in analysing methylation across the entire genome, including both CpG and non-CpG contexts, please refer to Whole Genome Methylation Sequencing.
Applications of Reduced Representation Bisulfite Sequencing:
RRBS is a powerful tool for studying DNA methylation in a targeted, cost-effective way and has diverse applications across fields such as:
- Cancer research: Study abnormal methylation patterns that may be linked to tumorigenesis.
- Developmental biology: Explore epigenetic changes during development and their influence on developmental processes
- Neuroscience and aging: Investigate methylation changes associated with neurological disorders or the aging process
- Environmental epigenetics: Examine how environmental factors influence DNA methylation
- Pharmacology: Study how drug treatment affects methylation in organisms
Benefits of Novogene’s RRBS service:
- Extensive Experience: Novogene has extensive experience in conducting RRBS on a wide variety of species including humans, mice, rats and cattle.
- High-Quality Data: We deliver high-quality sequencing data that meets leading industry standards.
- Bioinformatics Support: We provide comprehensive bioinformatics support and utilize the latest version of the industry-standard pipelines. Our bioinformatics report includes mC calling, as well as DMR (differentially methylated region) and DMP (differentially methylated position) analysis, as well as accompanying ‘publication ready’ figures. Customized bioinformatics support is also available.
- Fast Turnaround Times: Our sequencing labs are located near you, in Germany and the UK, allowing for reduced shipping times. With our large sequencing capacity and automated and streamlined workflows, we ensure that you receive your data promptly without compromising on quality.
- Customer Service System (CSS): Novogene’s Customer Self Service System (CSS) is an online project management portal that streamlines project management and provides direct access to all your sequencing projects in one place. You can view your sequencing project(s), track their progress, access reports, collaborate with your team members, and obtain other useful information at one place.
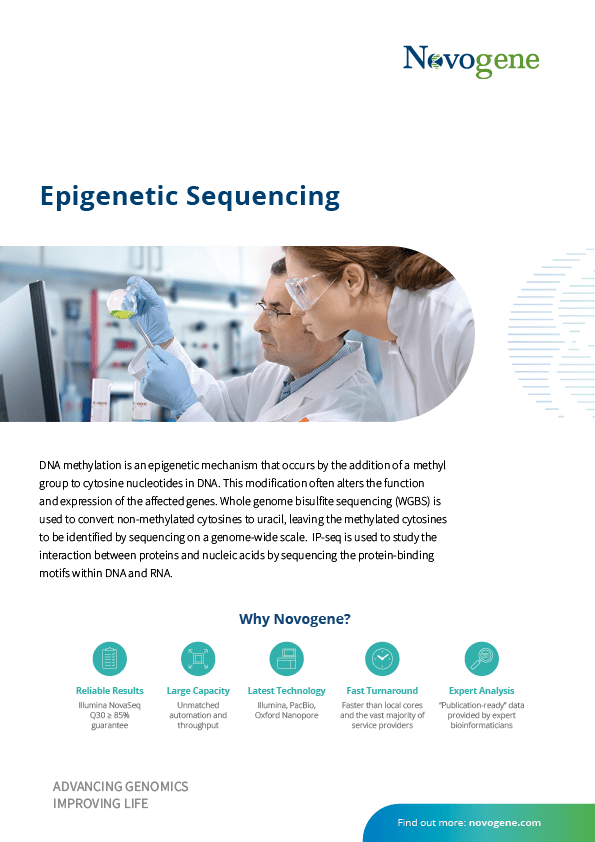
Epigenetic Sequencing Service Flyer
DNA methylation is an epigenetic mechanism that occurs by the addition of a methyl group to cytosine nucleotides in DNA. This modification often alters the function and expression of the affected genes. Whole genome bisulfite sequencing (WGBS) is used to convert non-methylated cytosines to uracil, leaving the methylated cytosines to be identified by sequencing on a genome-wide scale. IP-seq is used to study the interaction between proteins and nucleic acids by sequencing the protein-binding motifs within DNA and RNA.
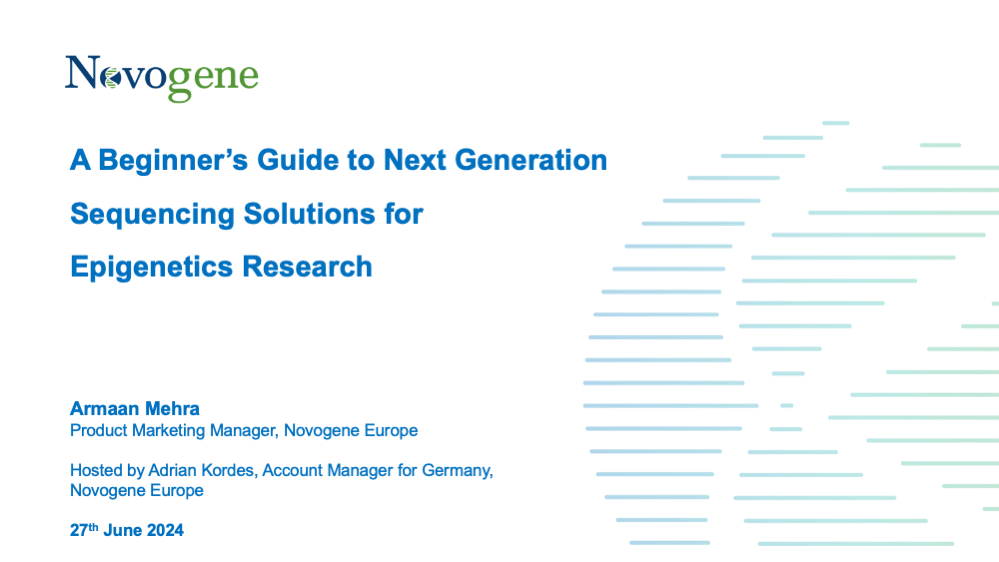
On-demand Webinar
A Beginner’s Guide to Next Generation Sequencing Solutions for Epigenetics Research
In this webinar, we will showcase Novogene’s diverse sequencing solutions for epigenetics research, including techniques to detect DNA methylation such as Whole Genome Bisulphite Sequencing and EM-seq, determining chromatin accessibility using ATAC-seq, and studying histone modifications (e.g., ChIP-seq), among others. We will delve into the underlying principles of these technologies, explore their various applications, and outline the workflows and analysis pipelines used to achieve comprehensive epigenetic insights.
We will talk about myriad microbial sequencing options such as microbial whole genome sequencing, metagenomics, and metatranscriptomics. We will also discuss recent advances in the field such as the applications of long-read sequencing and highlight Novogene’s diverse microbial sequencing solutions to aid your research.
Learning Objectives:
- Discover sequencing solutions tailored for epigenetics research
- Understand the principles and applications of the various NGS solutions for epigenetics research
- Gain insight into the workflows and bioinformatics analysis pipelines of Novogene’s epigenetics solutions.
RRBS Specifications: DNA Sample Requirements:
| Sample Type | Required amount | Volume | Concentration | Purity |
| Genomic DNA | ≥ 800 ng | ≥20 μL | ≥40 ng/μL | 0<OD260/230<3; no degradation, no contamination |
Note: Sample amounts are listed for reference only. Please don’t hesitate to reach out to us for detailed information or customized requests.
RRBS Specifications: Sequencing and Analysis
| Sequencing Platform | Illumina NovaSeq X Plus |
| Read Length | Paired-end 150 bp |
| Recommended Data Amount | ≥ 10 Gb clean data per sample |
| Content of Data Analysis |
|
Note: Sequencing parameters and analysis contents displayed are only for reference. Please contact us for detailed information.
Project Workflow of Novogene’s RRBS Service
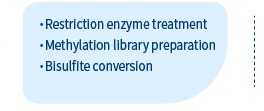
Novogene’s RRBS service comprises several steps, including sample QC, sample processing, DNA library preparation, Illumina PE150 sequencing and data analysis using bioinformatics pipelines. From DNA sampling to sequencing library preparation, every step can potentially impact the quality and quantity of data output, directly influencing the results of the subsequent bioinformatics analysis. Novogene performs rigorous checks at every stage, including sample quality control, library quality control, and sequencing data quality control to ensure the highest quality, accuracy, and reliability of the sequencing data delivered to our customers.

-
BMC Plant BiologyIssue Date: 6 June 2024IF: 4.3DOI: 10.1186/s12870-024-05197-z
-
Aberrant DNA methylation distorts developmental trajectories in atypical teratoid/rhabdoid tumors
Life Science AllianceIssue Date: 18 March 2024IF: 4.4DOI: 10.26508/lsa.202302088
-
The RNA m5C modification in R-loops as an off switch of Alt-NHEJ
Nature CommunicationsIssue Date: 30 September 2023IF: 16.6DOI: 10.1038/s41467-023-41790-w
-
An atlas of regulatory elements in chicken: A resource for chicken genetics and genomics
Science AdvancesIssue Date: 3 May 2023IF: 14.957DOI: 10.1126/sciadv.ade1204
-
Variation in DNA methylation in avian nestlings is largely determined by genetic effects
MOLECULAR BIOLOGY AND EVOLUTIONIssue Date: 11 April 2023IF: 8.8DOI: 10.1093/molbev/msad086
-
Dynamics of the Equine Placental DNA Methylome and Transcriptome from Mid- to Late Gestation
INTERNATIONAL JOURNAL OF MOLECULAR SCIENCESIssue Date: 11 April 2023IF: 6.208DOI: 10.3390/ijms24087084
-
Frontiers in EndocrinologyIssue Date: 23 October 2023IF: 5.2DOI: 10.3389/fendo.2023.1280847
-
Evolutionary ApplicationsIssue Date: 13 March 2024IF: 4.1DOI: 10.1111/eva.13664
-
JOURNAL OF EVOLUTIONARY BIOLOGYIssue Date: 22 February 2023IF: 2.516DOI: 10.1111/jeb.14162
Methylation Level Distribution in Whole Genome
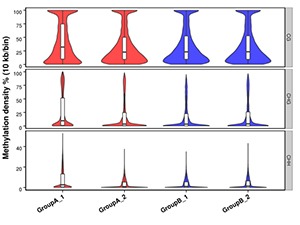
The whole genome is divided into sub-bins by 10kb. We analyze the C sites in every context for each sample (or each group, combine the samples if the biological replicates are > 5).
Note:
Methylation density for each comparison group.
Circos Plots for Methylation Density on Chromosome
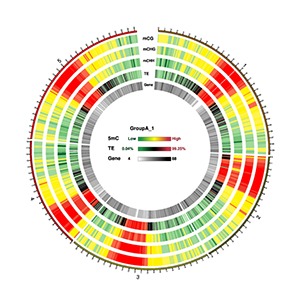
Circos plots are typically used to demonstrate massive genomic data across several chromosomes within a single plot. We have used Circos plot to represent the methylation density on a chromosome (Silin Zhong , James J Giovannoni et al. (2013) and Krzywinski , M. et al. (2009) Circos )
Note:
Circos plot represents (from outside to inside):1. The heatmap for methylation density in CG context 2. The heatmap for methylation density in CHG context 3. The heatmap for methylation density in CHH context 4. The heatmap for TE(repeat elements)rate 5. The heatmap for gene density
Methylation Level Distribution of All Samples in Genomic Features
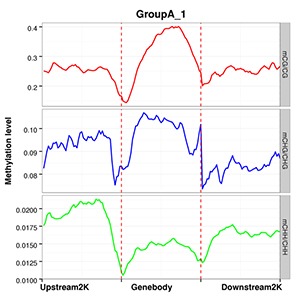
The average methylation levels with different cytosine contexts are calculated in different functional genomic regions such as promoter, exon, intron, CGI, CGI shore, repeat(Promoter region is the 2kb region above TTS, 5’UTR, Exon and Intron are obtained from the Ensembl structure annotation files).
Note:
The x-axis represents different genomic elements, and the y-axis represents methylation levels. The various functional areas of each gene are divided into 20 bins, and the average methylation level within each bin region is calculated. Different colours stand for different contexts (CpG, CHG, CHH).
Heatmap Analysis of Gene Functional Region Methylation Levels in Different Sequence Environments of Different Samples
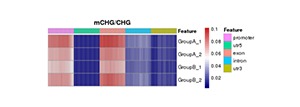
The heatmap analysis of the methylation level of the functional regions between samples reflects the degree of agreement of the methylation level distribution of each sample in the gene function region. Data of this heatmap analysis is extracted from the methylation level of genomic features for a single sample.
Note:
In the figure, darker red means high methylation levels, and darker blue depicts low methylation levels.
*Please contact us to get the full demo report.
