Introduction to Plant and Animal Whole Genome Sequencing


Plant and Animal Whole Genome Sequencing (PAWGS) is a powerful technique that allows researchers to sequence the entire genome of an animal or a plant. It enables determination of the complete genetic sequence with single nucleotide resolution. PAWGS, focused on resequencing the genome of a species, can be used to identify genetic variations, including single nucleotide variants (SNVs), insertions and deletions (InDels), copy number variants (CNVs), and structural variants (SVs). These variants can be used to study a wide range of topics, including evolution, population genetics and disease genomics.
Novogene has an extensive experience with Plant and Animal Whole Genome Sequencing for a wide variety of plant and animal species. We provide PAWGS resequencing service, with the choice of opting for either long read or short read sequencing strategy depending on the research objective. Our service is complete with high-quality data, bioinformatics analysis to assist with data interpretation and “publication-ready’’ figures accompanying the analysis. PAWGS has found its applications in several fields including population genetics research, genome-wide association studies (GWAS), animal breeding programs, agricultural research, etc.
Applications of Plant and Animal Whole Genome Sequencing
PAWGS has been assisting researchers in the following research areas, including:
- Evolutionary biology and genetics
- Plant and animal disease treatment approaches
- Animal and crop breeding programs
- Mutagenesis studies
If you are instead interested in applications requiring de novo sequencing of plant and animal species, please refer here.
Benefits of Novogene’s Plant and Animal Whole Genome Sequencing service
- Extensive Experience: Novogene has extensive sequencing experience with a wide range of plant and animal species.
- High-Quality Data: We deliver high-quality sequencing data that meets leading industry standards.
- Bioinformatics Support: We provide comprehensive bioinformatics analysis, complete with ‘publication ready’ figures. Customized bioinformatics support is available for studies requiring GWAS (Genome wide association studies), GBS (Genotyping by sequencing), BSA (Bulked segregant analysis), population structure analysis, etc.
- Short Read and Long Read Sequencing: Novogene provides the option of carrying out resequencing of plant and animal samples with short read and long read sequencing strategies.
- Fast Turnaround Times: Our sequencing labs are located near you, in Germany and the UK, allowing for reduced shipping times. With our large sequencing capacity, automated and streamlined workflows, we ensure that you receive your data promptly without compromising on quality.
- Customer Service System (CSS): Novogene’s Customer Self Service System (CSS) is an online project management portal that streamlines project management and provides direct access to all your sequencing projects in one place. You can view your sequencing project(s), track their progress, access reports, collaborate with your team members, and obtain other useful information at one place
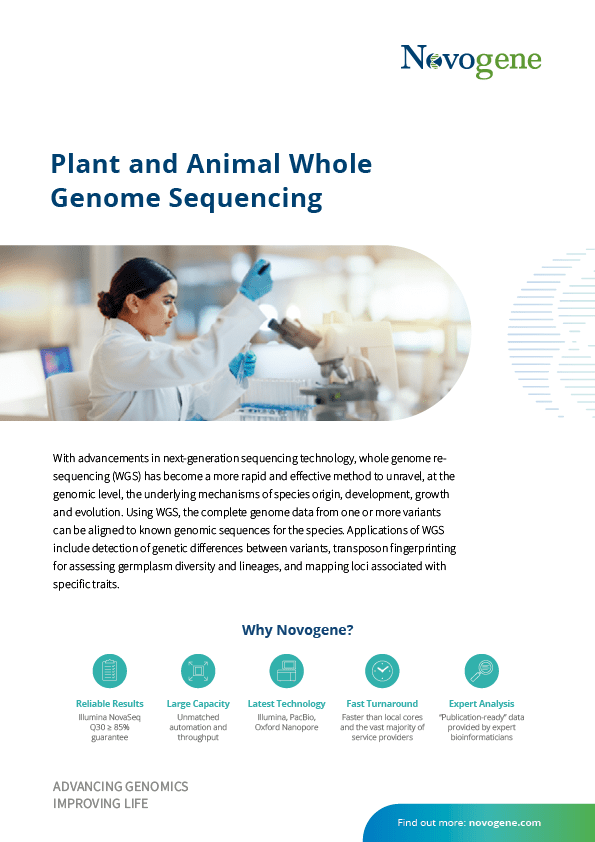
Plant and Animal Whole Genome Sequencing Service Flyer
With advancements in next-generation sequencing technology, whole genome resequencing (WGS) has become a more rapid and effective method to unravel, at the genomic level, the underlying mechanisms of species origin, development, growth and evolution. Using WGS, the complete genome data from one or more variants can be aligned to known genomic sequences for the species. Applications of WGS include detection of genetic differences between variants, transposon fingerprinting for assessing germplasm diversity and lineages, and mapping loci associated with specific traits.
On-demand Webinar
Getting Started with Genomics: Next Generation Sequencing Essentials for 2024
This webinar will provide an accessible introduction to NGS principles and its pivotal role in decoding the secrets of DNA. It will explore the basics of DNA sequencing applications and provide insights into the array of technological platforms available, including Illumina, PacBio, and Oxford Nanopore. Whether you’re a beginner or an experienced professional, this webinar is set to offer a foundational understanding of NGS that will enhance your journey with genomic technologies.
The session will also touch upon Novogene’s contributions to the genomics field and detail the expanded services available for European customers that have contributed to this.
Learning Objectives:
- Gain foundational knowledge of NGS principles
- Understand the basics of DNA sequencing applications and technologies
- Learn about recent developments in NGS technology and services.
Animal and Plant Specifications: DNA Sample Requirements
| Service | Sample Type | Amount (Qubit®) | Volume | Concentration | Purity(NanoDrop™/Agarose Gel) |
| Plant & Animal WGS(350 bp insert size) | Genomic DNA | ≥100 ng | ≥20 μL | ≥5 ng/μL | OD260/280 = 1.8-2.0; no degradation, no contamination Fragments longer than 1000 bp |
| PCR-freePlant & Animal WGS(350 bp insert size) | Genomic DNA | ≥1.2 μg | ≥20 μL | ≥20 ng/μL | OD260/280 = 1.8-2.0; no degradation, no contamination |
| PCR-freePlant & Animal WGS(custom size, ≤500 bp) | Genomic DNA | ≥2 μg | ≥20 μL | ≥30 ng/μL |
Novogene Workflow of Animal and Plant Genome Sequencing Service
From sample and library preparation, short and long-read sequencing, and data quality control, to bioinformatics analysis, Novogene provides high-quality products and professional services. Each step is performed in agreement with a high scientific standard and meticulous design to ensure high-quality research results.


Featured Publications of Animal and Plant Whole Genome Sequencing
-
CELLIssue Date: 15 May 2023IF: 66.85DOI: 10.2139/ssrn.4446759
-
The evolution of white-tailed jackrabbit camouflage in response to past and future seasonal climates
SCIENCEIssue Date: 23 March 2023IF: 63.714DOI: 10.1126/science.ade3984
-
Molecular CancerIssue Date: 29 May 2023IF: 41.444DOI: 10.1186/s12943-023-01792-0
-
NATURE GENETICSIssue Date: 28 August 2023IF: 30.8DOI: 10.1038/s41588-023-01486-9
-
A wheat kinase and immune receptor form host-specificity barriers against the blast fungus
Nature PlantsIssue Date: 16 February 2023IF: 17.352DOI: 10.1038/s41477-023-01357-5
-
Holocentromeres can consist of merely a few megabase-sized satellite arrays
Nature CommunicationsIssue Date: 13 June 2023IF: 16.6DOI: 10.1038/s41467-023-38922-7
-
Resequencing of 1,143 indica rice accessions reveals important genetic variations and different heterosis patterns
Journal: Nature CommunicationsDate: 22 September, 2020IF: 12.121DOI:https://www.nature.com/articles/s41467-020-18608-0
-
Journal:Plant Biotechnology JournalIssue date: 18 September, 2020IF: 8.154DOI: https://onlinelibrary.wiley.com/doi/10.1111/pbi.13480
-
Journal: Molecular Plant date: 5 September, 2020IF:12.084DOI:
https://www.cell.com/molecular-plant/fulltext/S1674-2052(20)30296-3?_returnURL=https%3A%2F%2Flinkinghub.elsevier.com
%2Fretrieve%2Fpii%2FS1674205220302963%3Fshowall%3Dtrue -
Journal:Nature GeneticsIssue date: 2018IF: 27.959DOI: https://www.nature.com/articles/s41588-018-0119-7
-
Genome re-sequencing reveals the evolutionary history of peach fruit edibility
Journal: Nature CommunicationsIssue date: 2018IF:12.353DOI:https://www.nature.com/articles/s41467-018-07744-3
Demo Result
Sequencing Quality Distribution
Sequencing quality distribution is examined over the entire length of all sequences, to detect regions where incorrect bases are incorporated at abnormally high levels. The detailed sequencing quality distribution is as follows.

Distribution of sequencing quality
Note: The x-axis shows the base position within a sequencing read, and the y-axis shows the average phred score of all reads at each position.
(Pair-end sequencing data are plotted together, with the first PE150 bp representing read 1 and the following PE150 bp for read 2.)
Sequencing Error Rate
The sequencing error rate is the major confounding factor of precise detection of low-frequency variations by deep sequencing. It determines the quality of the sequencing data. The sequencing error rate is highly associated with the sequencing cycle, escalating towards the end of each read because of the consumption of chemical reagents, which is a common feature of the Illumina high throughput sequencing platform.

Distribution of sequencing error rate
Note: The x-axis shows the base position along each sequencing read and the y-axis shows the base error rate.
(Pair-end sequencing data are plotted together, with the first PE150 bp representing read 1 and the following PE150 bp describes read 2.)
Filtering reads containing adapter or with low quality
The sequencingraw reads often contain low-quality reads or reads with adaptors, which influences the quality of the downstream analysis. To avoid this, it is necessary to filter out the raw reads and obtain clean reads. Raw reads filtering should be done under the following conditions:
(1) Remove the paired reads when either read contains adapter contamination;
(2) Remove the paired reads when uncertain nucleotides (N) constitute more than 10 percent of either read;
(3) Remove the paired reads when low quality nucleotides (base quality less than 5, Q ≤ 5) constitute more than 50 percent of either read.

Note:
Classification of the sequenced reads
(1) Adapter related: (reads containing adapter) / (total raw reads).
(2) Containing N: (reads with more than 10% N) / (total raw reads).
(3) Low quality: (reads of low quality) / (total raw reads).
(4) Clean reads: (clean reads) / (total raw reads).
Alignment with reference genome
Mapping Statistics with Reference Genome

The mean depth of each chromosome.
Note: The x-axis shows the chromosome and the y-axis shows the mean depth
Standard Analysis
SNP Detection & Annotation
ANNOVAR is a software that efficiently annotates genetic variants spotted from the genome utilizing contemporary information. Provided an index of variants with reference nucleotide, start position, end position, observed nucleotides, and chromosome, ANNOVAR can perform gene-based annotation, region-based annotation, filter-based annotation as well as other functionalities.

Note: The figure demonstrates the distribution of (A) The number of SNPs in different regions of the genome (left) and (B) the number of SNPs of different types in the coding region (right)
SNP Quality Distribution
To assess the credibility of detected SNPs, we checked the distribution of support reads number, SNP quality, as well as the distance between adjacent SNPs. The results as follows.

Cumulative distribution of SNP quality
Note: These figures demonstrate the quality distribution of SNPs, distribution of SNP support reads number, distribution of distances between adjacent SNPs, and the cumulative distribution of SNP quality.
SNP Mutation Frequency
Take the T:A>C:G mutations as an example, this category includes mutations from T to C and A to G. When T>C mutation appears on either of the double-strand, the A>G mutation will be found in the same position of the other chain. Therefore the T>C and A>G mutations are classified into one category. Accordingly, the whole-genome SNP mutations could be classified into six categories.


Frequency of SNP mutations
Note:The x-axis represents the number of the SNPs, and y-axis indicates the mutation types.
CNV Detection & Annotation
Copy-number variation (CNV) is a type of structural variation that happens when a DNA fragment is present in variable copy number in comparison to a reference genome. It pinpoints the deletions and duplications in the genome. Based on the reads depth of the reference genome, CNVnator can be used to detect CNVs of potential deletions and duplications with the following parameter ‘-call 100’. The detected CNVs are then further annotated by ANNOVAR.

CNV annotation

Ann Variation type statistics distribution of CNVs
Note:The x-axis represents samples, and the y-axis indicates the proportion of each type of CNVs.
*Please contact us to get the full demo report.
