Introduction to Olink® Reveal
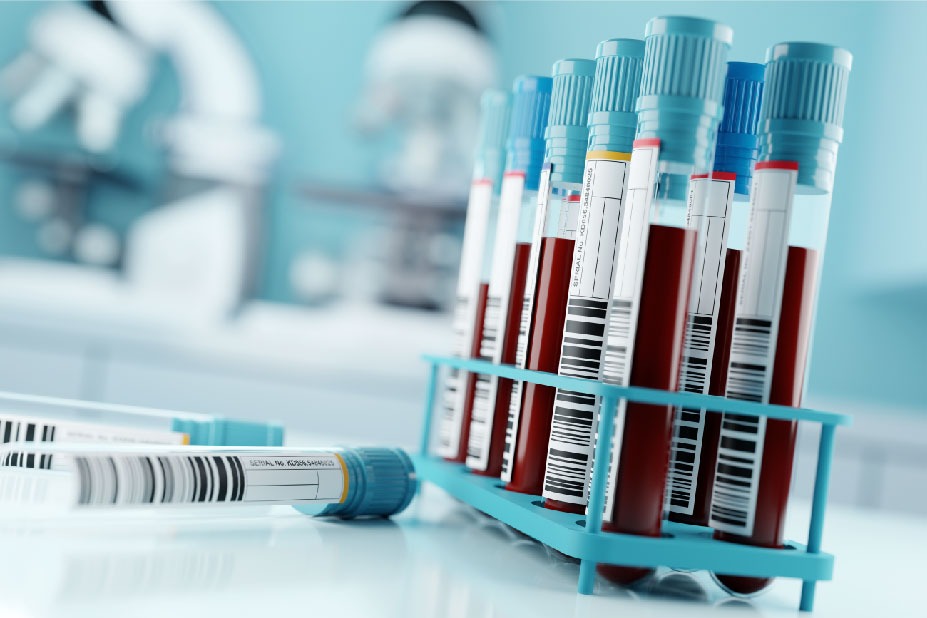

Olink® Reveal is a cutting-edge proteomics solution that brings together the power of Next-Generation Sequencing (NGS) and Olink’s Proximity Extension Assay (PEA) technology. Designed for large-scale protein biomarker discovery in human body fluids – such as serum or plasma – Reveal enables the simultaneous measurement of >1,000 proteins from minimal sample volumes.
This powerful combination delivers exceptional specificity, sensitivity, and scalability, making Reveal an ideal choice for researchers exploring complex biological systems, disease pathways, and potential therapeutic targets.
What sets Olink® Reveal apart?
It uniquely balances broad protein coverage with cost-effectiveness, empowering groundbreaking discoveries without compromising efficiency.
Applications of Olink® Reveal
Olink® Reveal panel can aid researchers belonging to diverse areas, including:
- Biomarker Discovery & Disease Research
- Immunology & Inflammation Research
- Precision Medicine & Population Health Studies
- Metabolism research
Benefits of Novogene’s Olink® Reveal service
- End to end service: Novogene provides an end-to-end service from sample processing to data analysis. Not just that! We are also an Olink certified provider.
- High-Quality Data: We deliver high-quality sequencing data that meets leading industry standards.
- Bioinformatics Support: We provide comprehensive bioinformatics support, including analysis of protein expression level, differential protein expression, and functional analysis.
- High Throughput: Olink® Reveal allows rapid detection of >1,000 protein markers in a sample and can support large scale studies.
- High sensitivity and wide dynamic range: Detection sensitivity from fg/mL to mg/mL. The dynamic range spans 10 logs, and allows for full coverage of high, medium and low abundance proteins.
Olink® Reveal – Sample Requirements
| Sample type | Volume | Notes |
| Human Plasma/Serum | ≥50 μL | • Please include enough dry ice and send by frozen delivery to avoid sample thawing during shipping. • It is recommended to store samples at −80 °C immediately after extraction as hemolysis may affect the analysis results |
| Other sample matrices | Examples – CSF, lysates, cell culture supernatant, etc. Please contact us for more information. |
|
Project Workflow of Novogene’s Olink® Reveal service
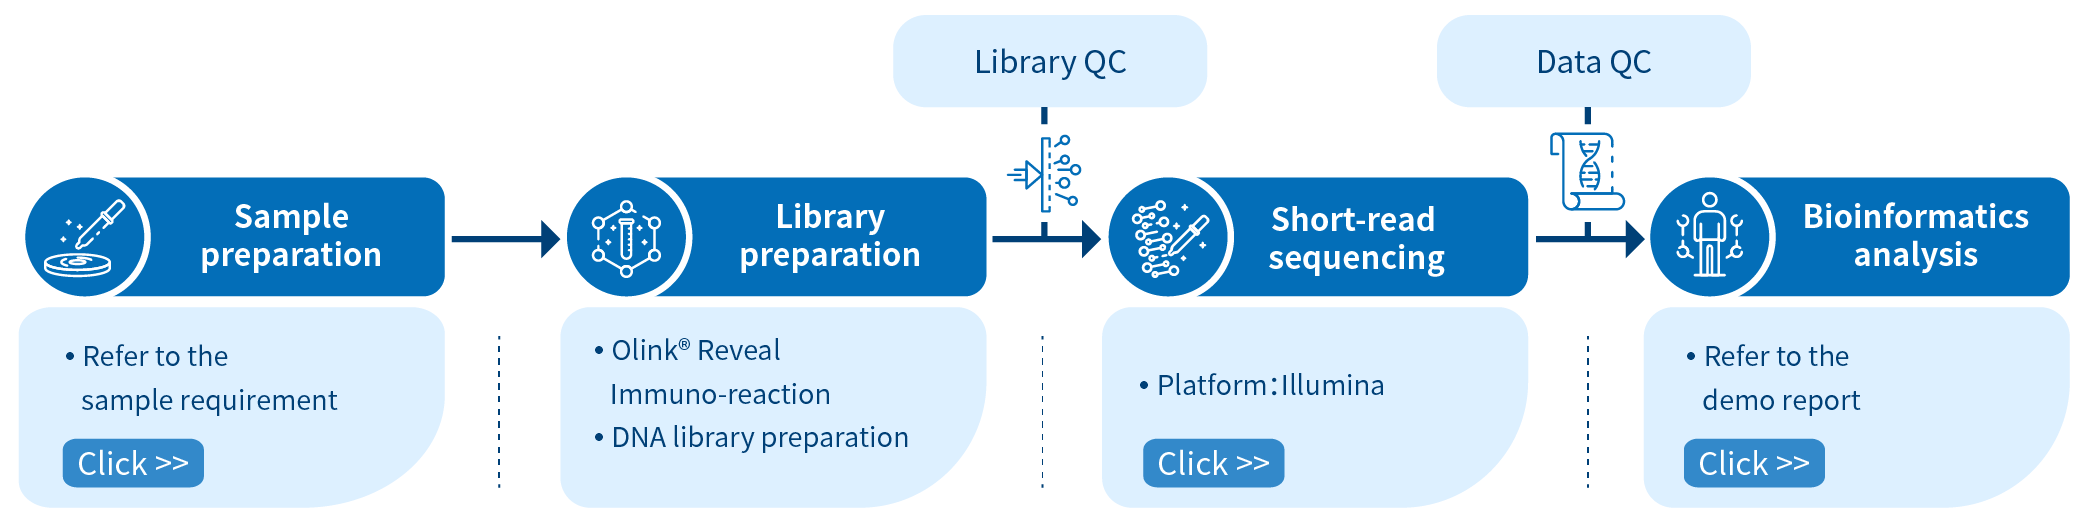
From sample processing, library preparation, DNA sequencing and data quality control, to bioinformatics analysis, Novogene provides high-quality and professional services. Each step is performed in agreement with a high scientific standard and meticulous design to ensure high-quality research results.
Data Normalization and Quality Control Using NPX Values
NPX, Normalized Protein eXpression, is Olink’s arbitrary unit which is in Log2 scale. Following sequencing, the raw data is converted to counts, assigning an integer value to each assay-sample combination based on the detected copy numbers. These raw data counts are converted into NPX values, enabling the identification of protein level changes within different sample sets, and establishing protein signatures. In general, a higher NPX value refers to a higher protein concentration.
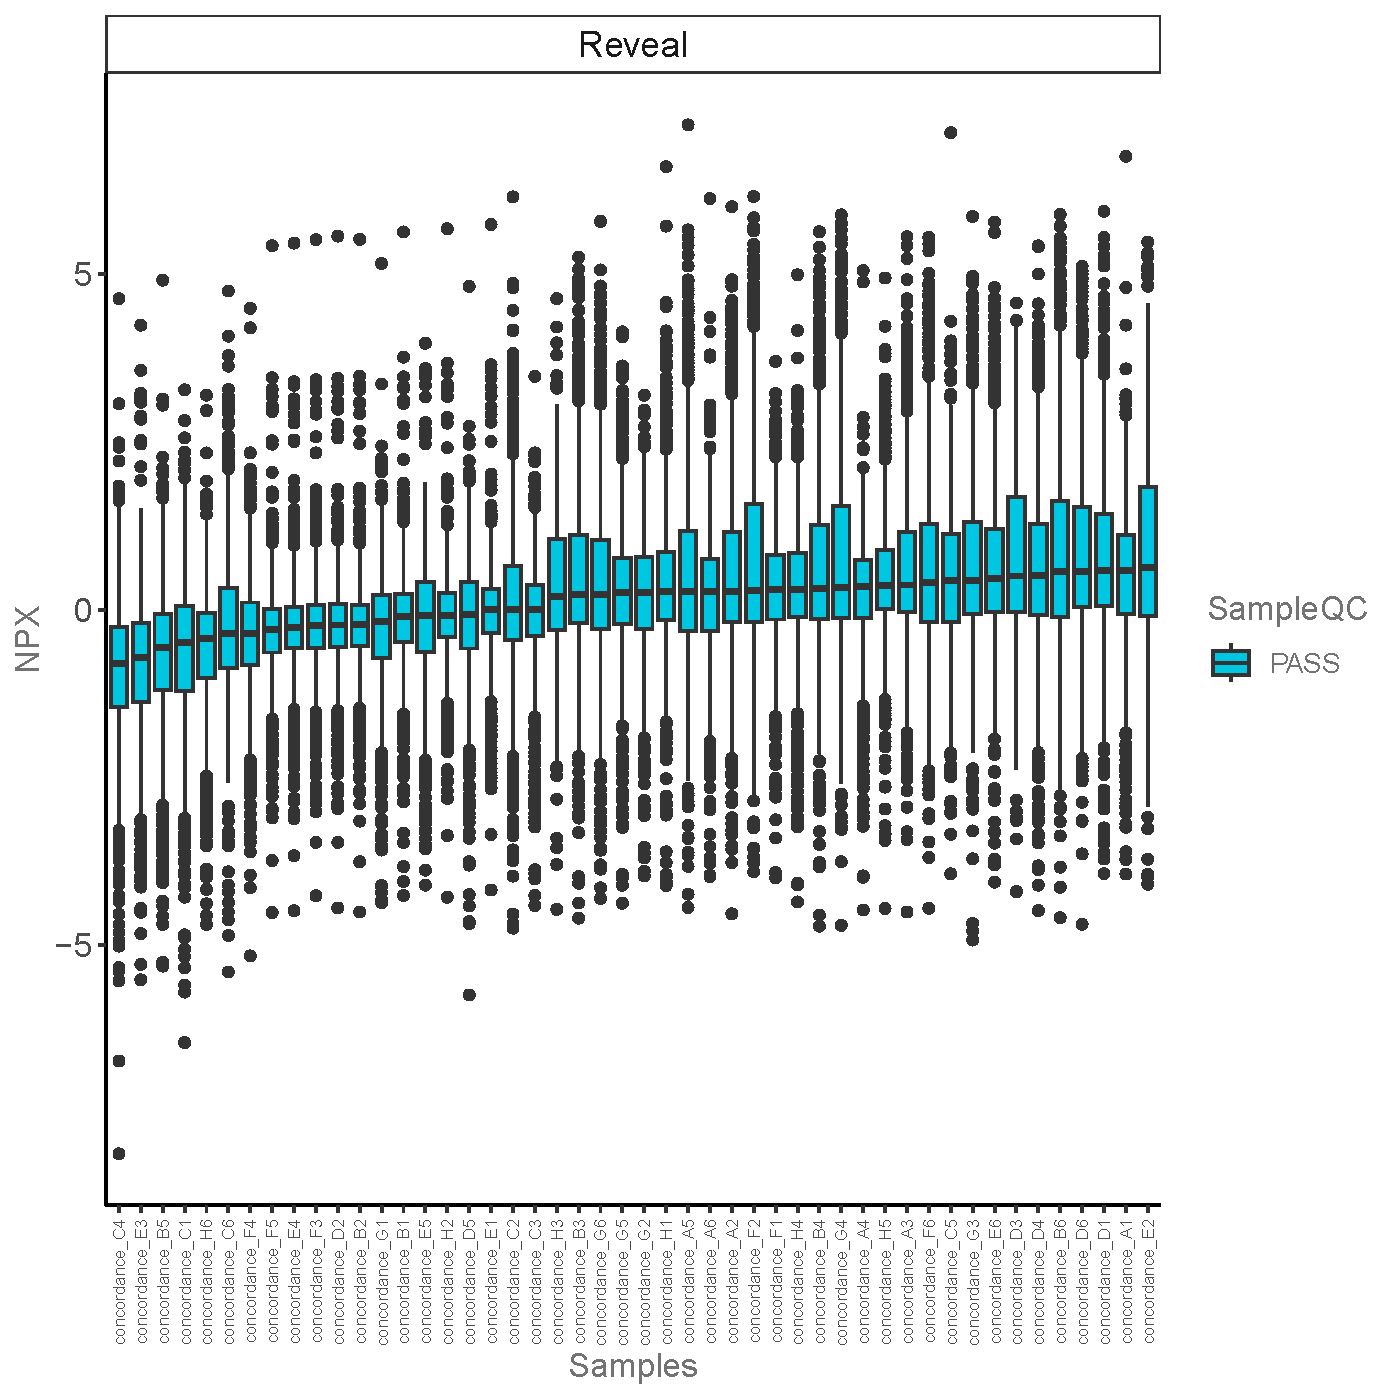
The x-axis represents the sample names. The y-axis represents the NPX values. Blue bars represent QC pass samples.
Principal Component Analysis of Protein Expression
Principal component analysis (PCA) is a statistical technique for analyzing large dataset by reducing the dimensionality of the dataset. In this analysis, PCA is conducted on the NPX data file, and all samples are plotted as a scatterplot along the selected principal components. It can be useful for showing that samples are separate, or cluster based on variables of interest. In addition, it can be used to identify potential outlier samples.
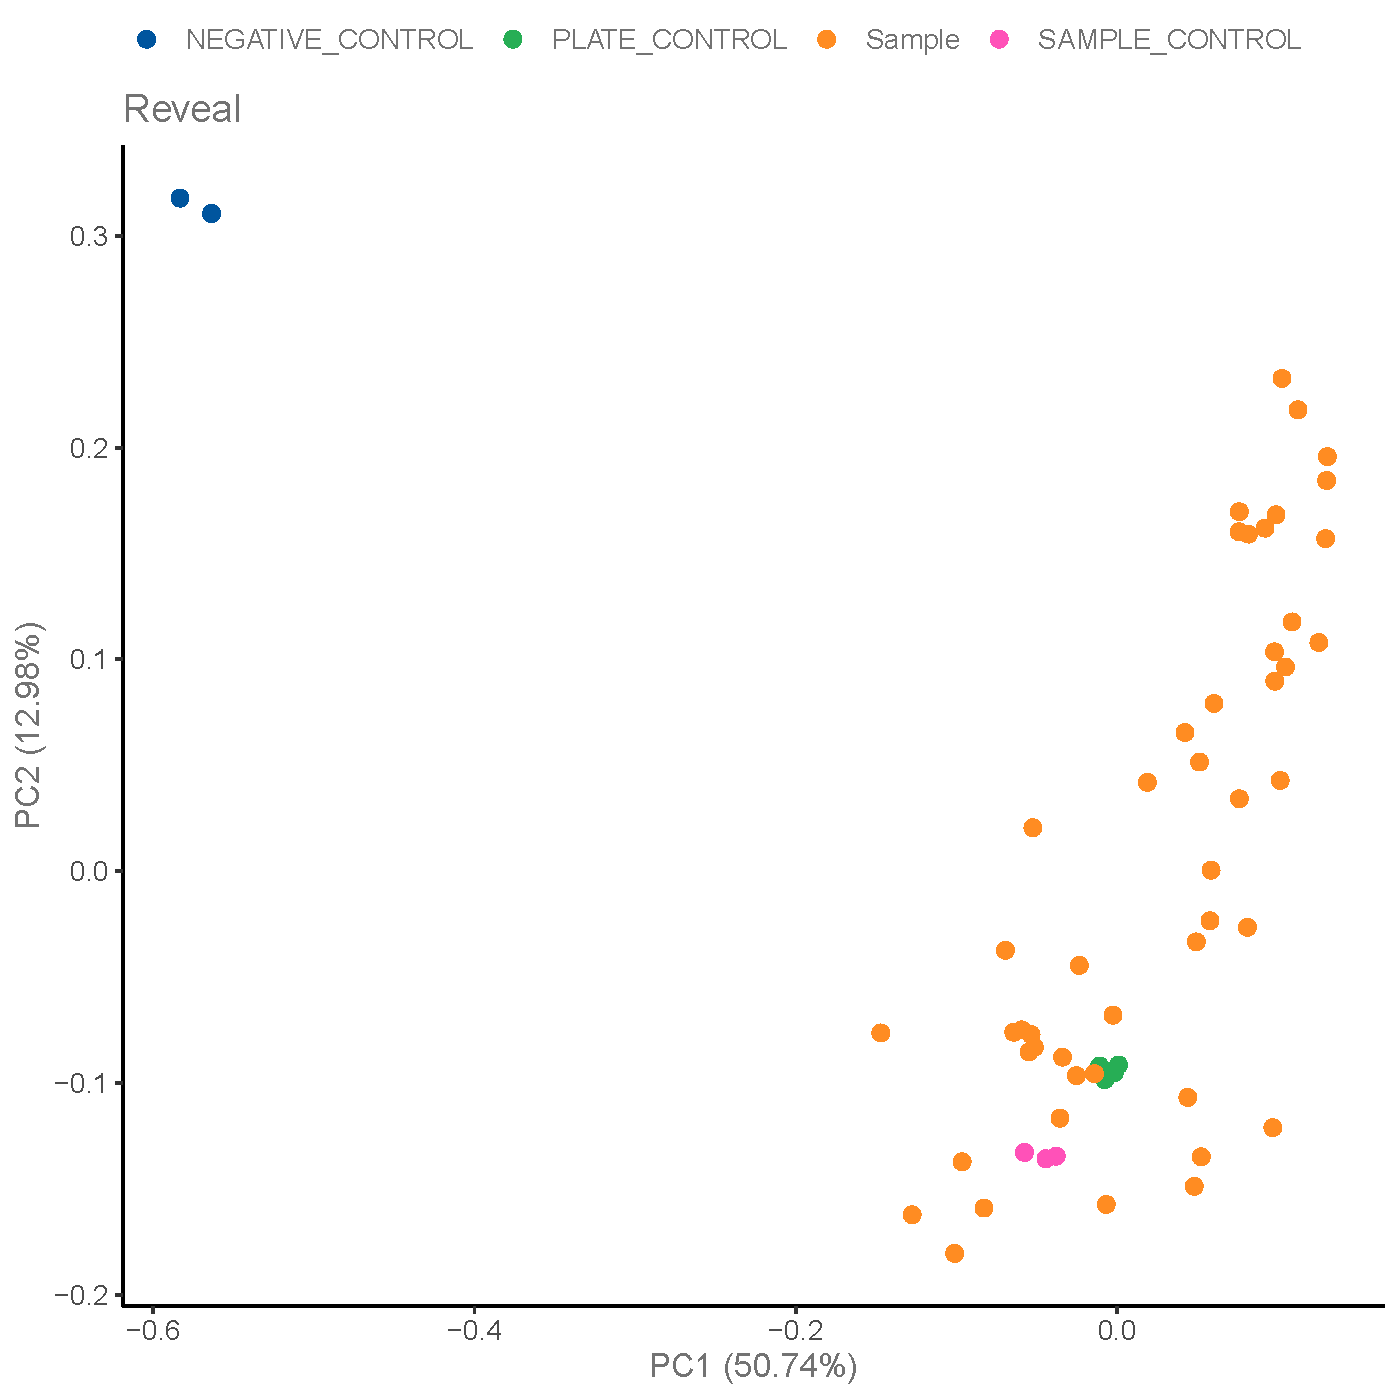
Dots in different colors represent different groups. The closer the distance between samples, the higher the similarity between samples.
Hierarchical Clustering Heatmap of Protein Expression
Hierarchical clustering is a method used to get an overview of data, and to identify subgroups of similar samples or proteins based on protein profiles. This analysis is often visualized through a heatmap, where similar proteins or samples are positioned adjacent to each other. The protein expression levels are then represented using a color gradient on the heatmap.
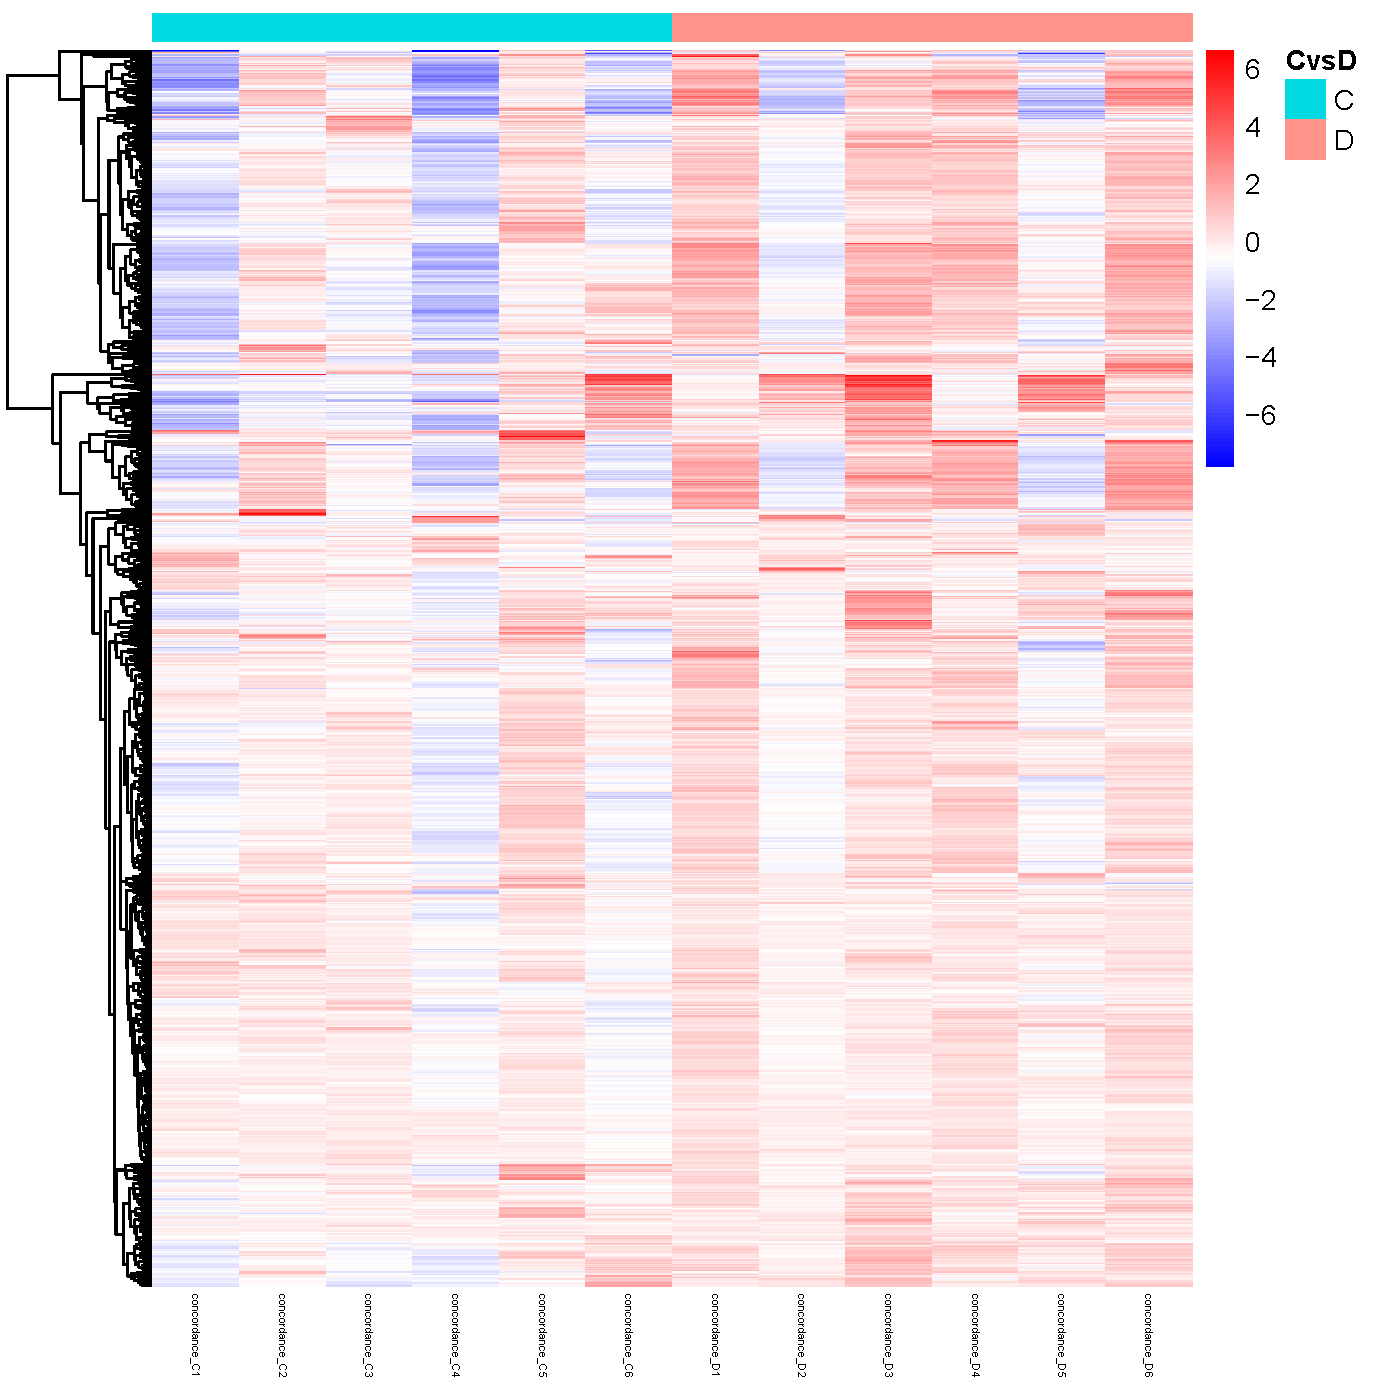
Red color indicates proteins with higher NPX expression levels, and blue color indicates proteins with lower NPX expression levels. The color ranging from red to blue indicates that NPX values range from large to small.
Volcano Plot of Differential Protein Expression
The comparison of protein expression level among groups are performed using t-test or ANOVA and the result is visualized using volcano plot.
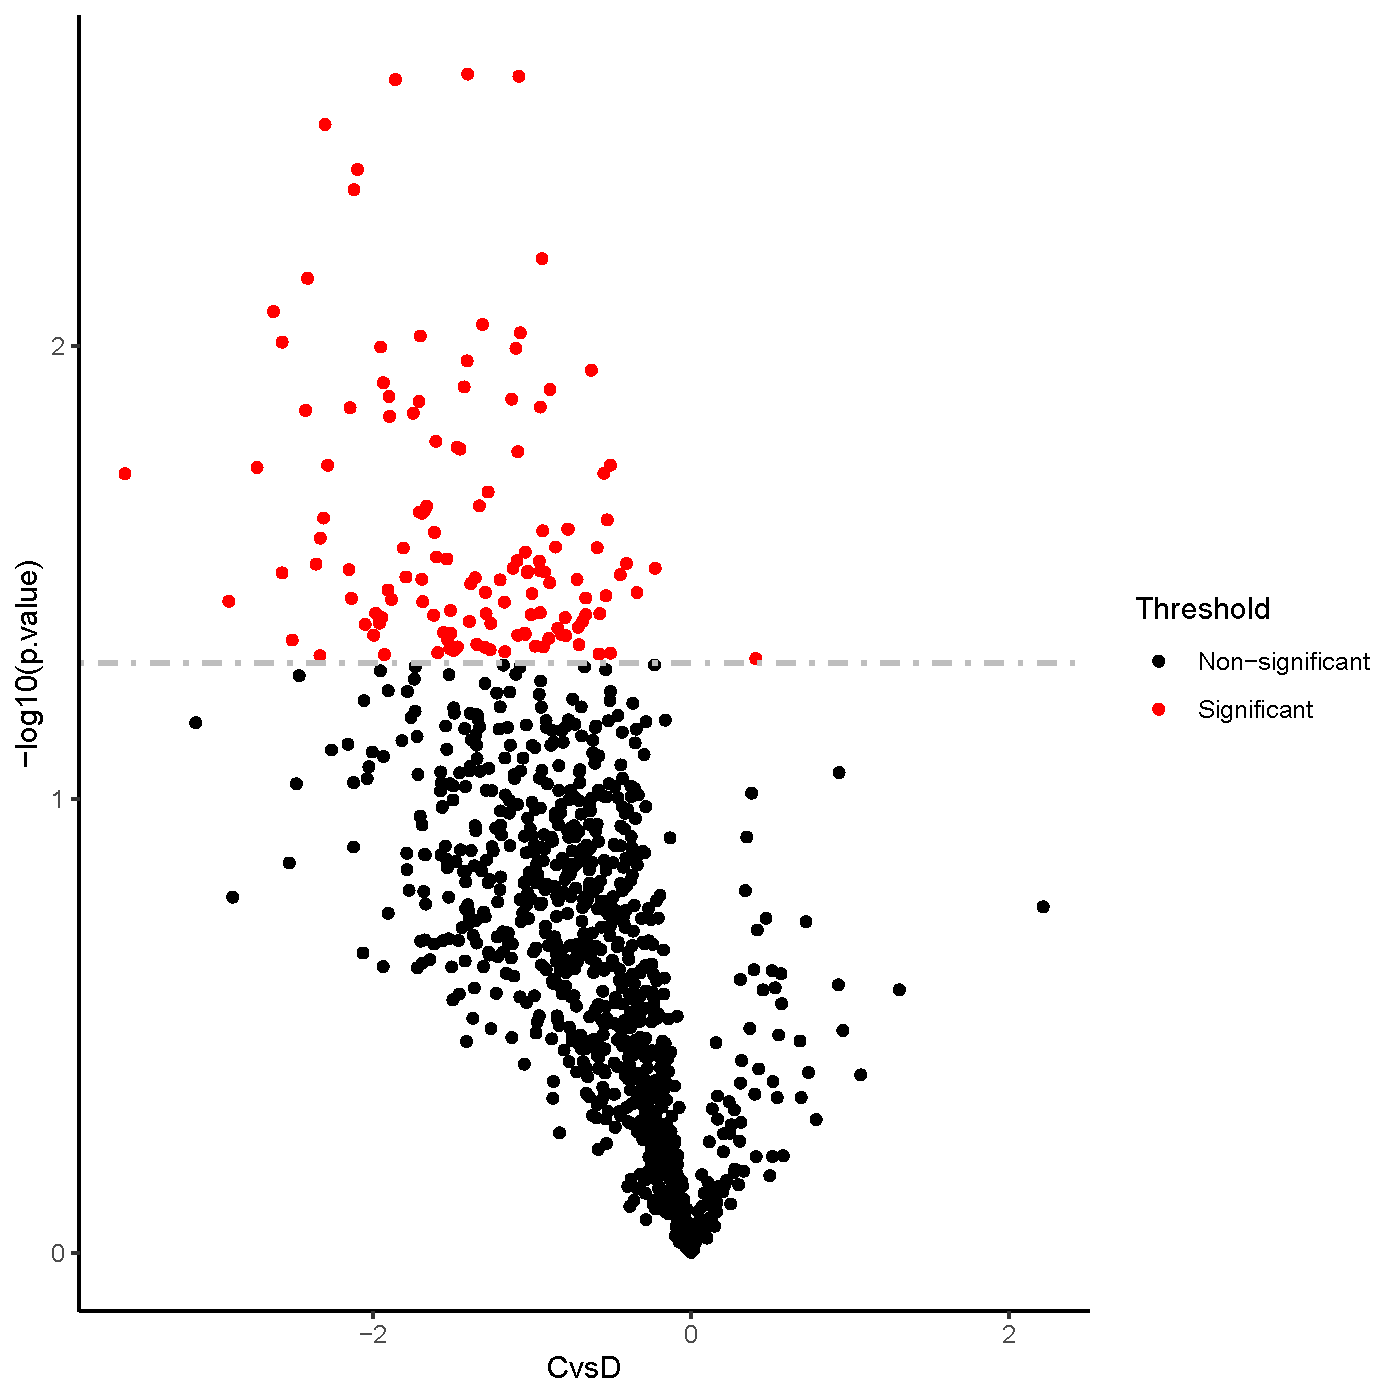
The x-axis shows the NPX.difference between two groups, and the y-axis shows the -log(p-value) value(base 10). NPX.different= NPX.group1 – NPX.group2. Red dots represent significant differentially expressed proteins. Back dots represent non-significant differentially expressed proteins.
Go Enrichment Analysis
GO is the abbreviation of Gene Ontology (http://www.geneontology.org/), which is a major bioinformatics classification system to unify the presentation of gene properties across all species. It includes three main branches: cellular component, molecular function, and biological process. GO terms with padj < 0.05 are significant enrichment.
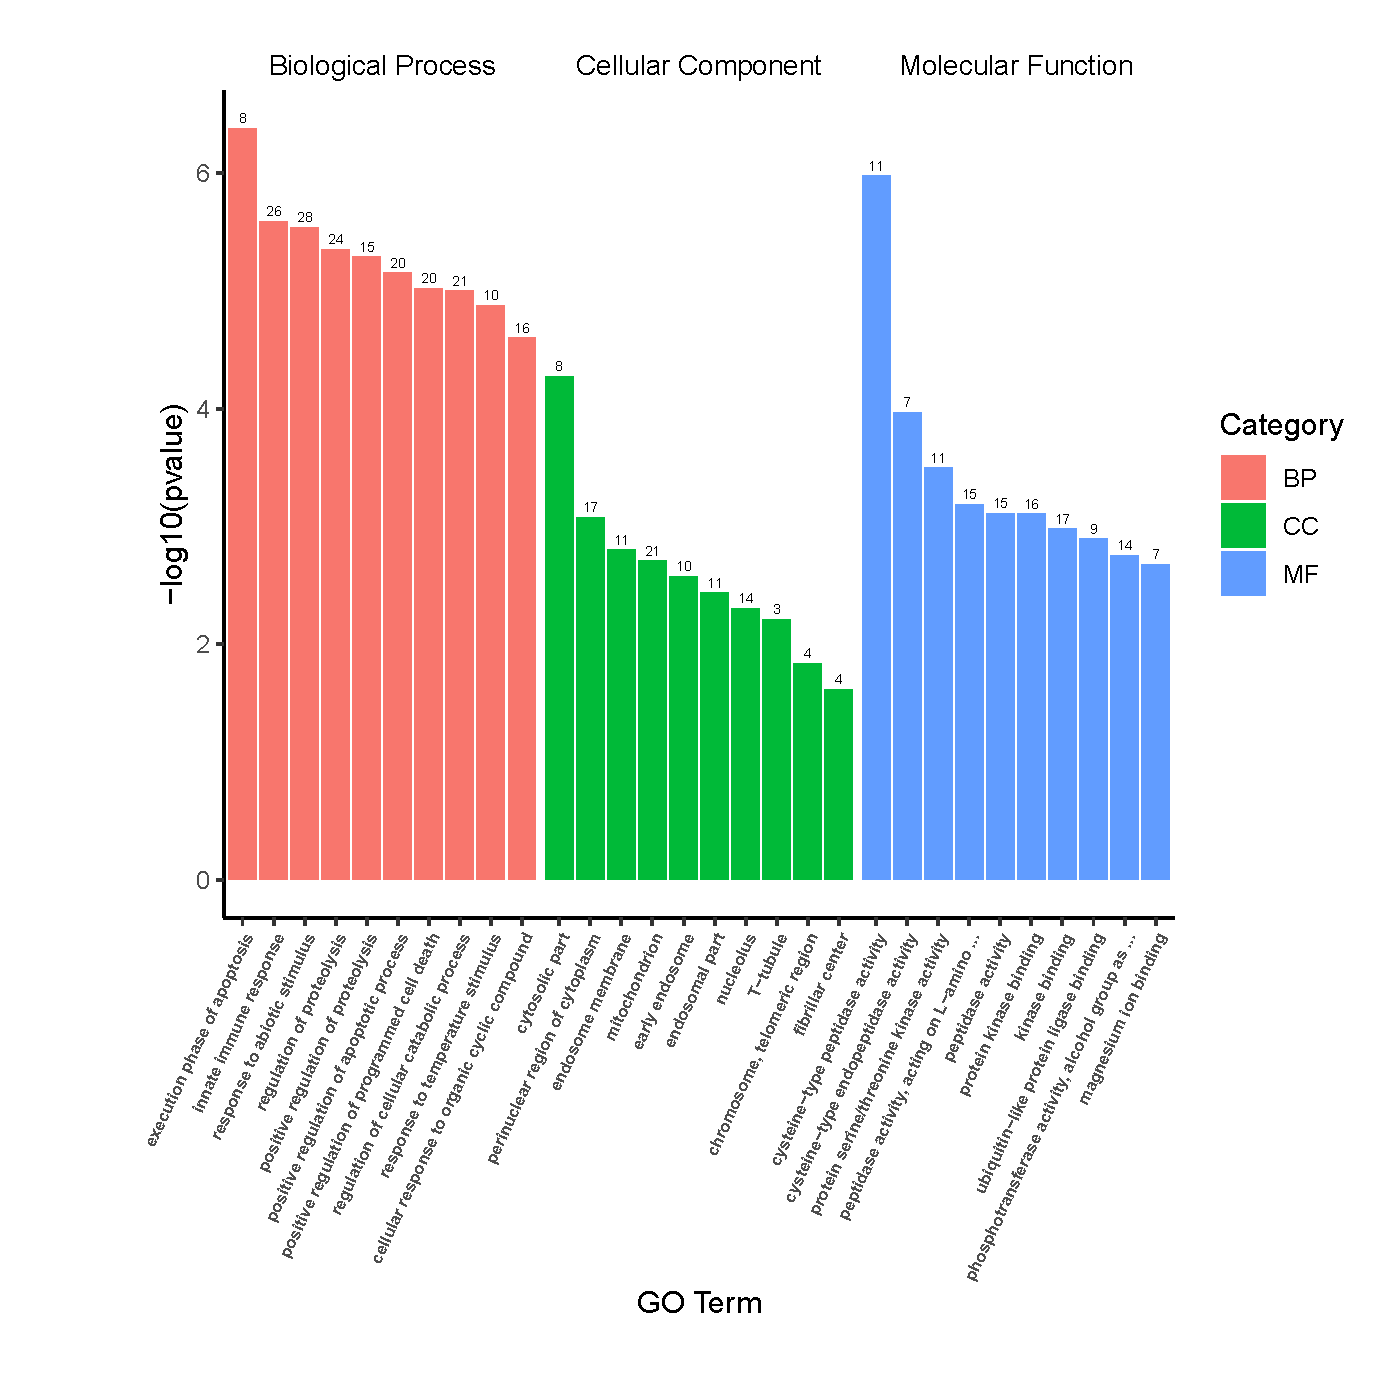
The x-axis represents the GO Term, and the y-axis indicates the level of significance of enrichment for each GO Term, expressed as -log10(padj). Different functional categories are represented by varying colors.
More Research Services
