RNA Integrity Number (RIN) Explained
At Novogene, we pride ourselves in the quality of the sequencing data we produce. High-quality sequencing data is the ultimate end goal of next generation sequencing. This final quality relies heavily on the quality of the starting material, so it is imperative that this quality is accurately assessed before proceeding with costly and time-consuming protocols. RNA is unstable and very susceptible to degradation if not handled correctly, so assessing it quality and integrity is a crucial step in ensuring its suitability for downstream processes.
There are several methods that can be employed to measure RNA quality. Using gel electrophoresis, RNA samples can be analysed for integrity by visually assessing the size and concentration of ribosomal RNA 28s and 18s subunit bands. Nanodrop instruments can be used to detect wavelengths that are indicative of protein or genomic DNA contamination. However, both approaches are susceptible to human error and significant variability across samples and individual instruments.
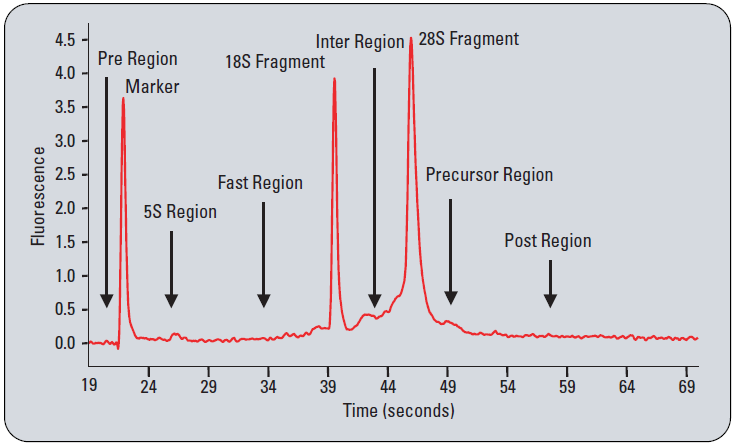 Figure 1. Electropherogram regions (1)
The gold standard for RNA integrity analysis is the RNA Integrity Number, or RIN value. This is a measurement established by Agilent using their 2100 Bioanalyzer instrument that takes into account the entire electropherogram of the RNA sample, as seen in Fig. 1. not just the rRNA peaks, to assign a value of 1-10 – 1 being the poorest quality and 10 being the highest. Figure 1 also represents an RNA sample with a RIN of 10, as does the first image in Figure 2. Both traces show clean, sharp rRNA peaks, with very little background noise and no other peaks aside from the marker.
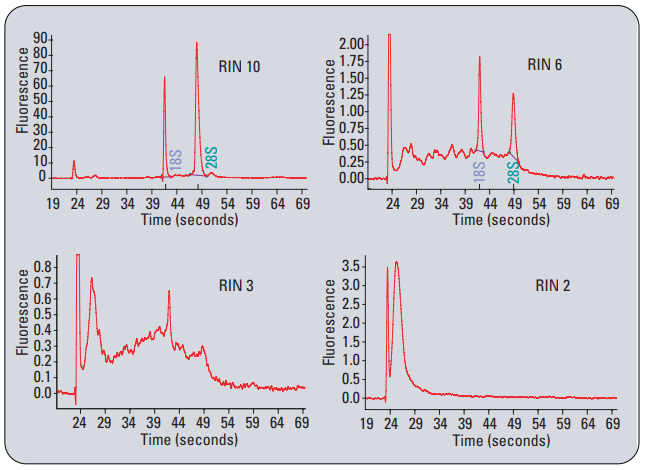 Figure 2. RIN value examples (1)
As a sample becomes more degraded, the RIN value decreases, and the profile of the sample electropherogram changes. Figure 2 shows this progression of degradation and decrease in RIN value. An increase in signal across the 5S and Fast regions is indicative of some degradation and the presence of some smaller RNA fragments. If there is still maintenance of strong rRNA peaks however, the RIN value is ~6. Further degradation is shown by larger peaks in the 5S and Fast regions and loss of rRNA peaks. Samples with very low RIN values will have RNA fragments smaller than the desired library insert size and will not be incorporated during library preparation. The minimum RIN value that can be accepted varies depending on species type, desired library insert size, desired library preparation protocol and the sequencing data amount required.
For FFPE samples, the RIN value will always be low as this method of preservation results in RNA degradation, however different methods of library preparation are used to circumvent this issue. A different QC value, known as the DV200 ratio, is used to assess the quality of the sample. If more than 50% of RNA fragments present are above 200 nucleotides in length, then library preparation can proceed.
RIN values are an important step in the standardisation of RNA quality control, and the establishment of this method has removed the need for user-dependent interpretation of RNA quality. This has resulted in the reproducibility of RNA quality analysis across experiments, samples, and even laboratories. The outcomes are independent of the instrument, sample concentration, and the user. This is a significant improvement to the previous standard for RNA integrity analysis, the rRNA subunit ratio, which only took into account the ribosomal subunit peaks. This value was subject to a much higher level of variance than RIN value, even across the same sample.
RIN value is one part of our RNA quality control at Novogene. If you would like information on how to run your own QC checks before sending us your samples, or more details on what the result of your QC means, please contact us at info@novogene-europe.com.
References:
- Mueller et al., 2016. RNA Integrity Number (RIN) – Standardization of RNA Quality Control. Agilent Technologies.
