Introduction to Human Whole Genome Sequencing


Human Whole Genome Sequencing (hWGS) is a powerful tool that has revolutionized our understanding of human biology and diseases. It enables researchers to comprehensively analyse the genetic makeup of individuals, identify genetic variants, including single-nucleotide variants (SNVs), insertions and deletions (InDels), structural variations (SVs), and copy number variations (CNVs), and diagnose diseases.
Novogene has extensive experience with hWGS and offers the option of carrying out hWGS projects using the latest short or long read sequencing strategies, to cater to projects with different research goals. Low pass WGS (lpWGS) or shallow whole genome sequencing is a cost-effective alternative for large cohorts and is useful for discovering new, rare variants. Our hWGS service is complete with high-quality data, bioinformatics analysis to assist with data interpretation and “publication-ready’’ figures accompanying the analysis.
Human Whole Genome Sequencing has a broad range of applications, including genetic diseases, cancers, pathogenesis mechanisms, or population genetics research. Long read sequencing technologies available at Novogene, such as those from PacBio and ONT can help one to sequence the highly polymorphic and repetitive regions within the genome and perform haplotype phasing, thereby providing a complete and accurate human genome characterization.
Applications of Human Whole Genome Sequencing
Human Whole Genome Sequencing has been assisting researchers in the following research areas, including:
- Genetic diseases
- Cancers
- Mechanisms of Pathogenesis
- Evolutionary Genetics
Benefits of Novogene’s Human Whole Genome Sequencing service
- Extensive Experience: Novogene has extensive experience with human whole genome sequencing using both long read and short read sequencing strategies.
- High-Quality Data: We deliver high-quality sequencing data that meets leading industry standards.
- Bioinformatics Support: We provide comprehensive bioinformatics support, including somatic and germline mutation analysis, complete with ‘publication ready’ figures using your database of choice. Customized bioinformatics support is also available for studies requiring tumour mutational burden, tumour heterogeneity, driver mutation analysis, etc.
- Short Read and Long Read Sequencing: Novogene offers you with the option of carrying out hWGS resequencing with short read or long read sequencing strategies. Long read sequencing strategies are particularly useful for sequencing repetitive regions, identifying variants > 500 bp in size and haplotype phasing.
- Cost Effective Strategies: Low-pass sequencing (lpWGS), and imputation services are available for genome-wide association studies (GWAS) which typically involve large cohorts.
- Fast Turnaround Times: Our sequencing labs are located near you, in Germany and the UK, allowing for reduced shipping times. With our large sequencing capacity, automated and streamlined workflows, we ensure that you receive your data promptly without compromising on quality.
- Customer Service System (CSS): Novogene’s Customer Self Service System (CSS) is an online project management portal that streamlines project management and provides direct access to all your sequencing projects in one place. You can view your sequencing project(s), track their progress, access reports, collaborate with your team members, and obtain other useful information at one place.
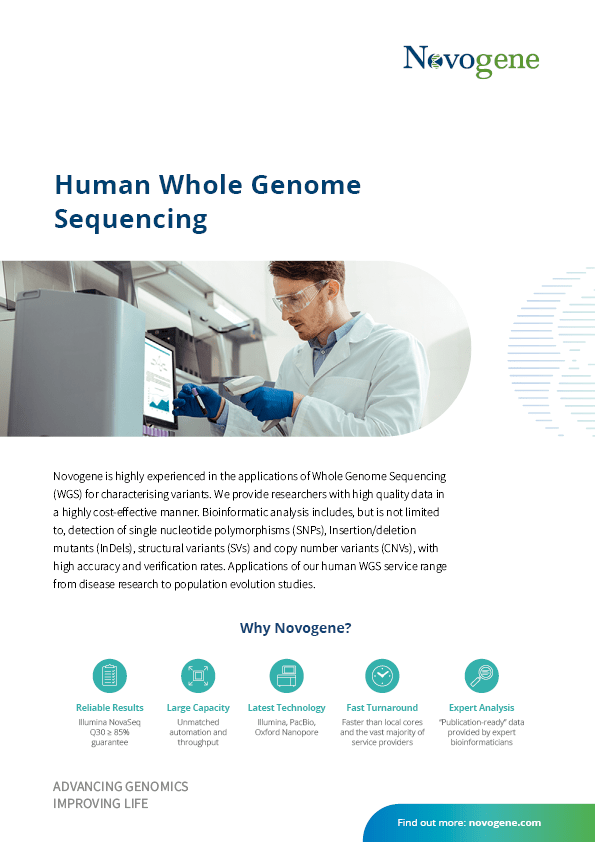
Human Whole Genome Sequencing Service Flyer
Novogene is highly experienced in the applications of Whole Genome Sequencing (WGS) for characterising variants. We provide researchers with high quality data in a highly cost-effective manner. Bioinformatic analysis includes, but is not limited to, detection of single nucleotide polymorphisms (SNPs), Insertion/deletion mutants (InDels), structural variants (SVs) and copy number variants (CNVs), with high accuracy and verification rates. Applications of our human WGS service range from disease research to population evolution studies.
On-demand Webinar
Getting Started with Genomics: Next Generation Sequencing Essentials for 2024
This webinar will provide an accessible introduction to NGS principles and its pivotal role in decoding the secrets of DNA. It will explore the basics of DNA sequencing applications and provide insights into the array of technological platforms available, including Illumina, PacBio, and Oxford Nanopore. Whether you’re a beginner or an experienced professional, this webinar is set to offer a foundational understanding of NGS that will enhance your journey with genomic technologies.
The session will also touch upon Novogene’s contributions to the genomics field and detail the expanded services available for European customers that have contributed to this.
Learning Objectives:
- Gain foundational knowledge of NGS principles
- Understand the basics of DNA sequencing applications and technologies
- Learn about recent developments in NGS technology and services.

hWGS Specifications: DNA Sample Requirements
Illumina
| Service | Sample Type | Amount (Qubit®) | Volume | Concentration | Purity (NanoDrop™/Agarose Gel) |
| Human WGS (350 bp insert size) | Genomic DNA | ≥100 ng | ≥20 μL | ≥5 ng/μL | OD260/280 = 1.8-2.0; no degradation, no contamination Fragments longer than 1000 bp |
| FFPE DNA* | ≥300 ng | ≥20 μL | ≥10 ng/μL | Fragments longer than 1000 bp | |
| cfDNA/ctDNA* | ≥30 ng | – | ≥0.5 ng/μL | Fragments of 170 bp or multiples, no genomic DNA contamination |
*Formalin-Fixed, Paraffin-Embedded; cell-free DNA, circulating-tumour DNA
PacBio
| Service | Sample Type | Amount (Qubit®) | Volume | Concentration | Purity |
| PacBio DNA HiFi library | HMW* genomic DNA | ≥5 μg | ≥50 μL | ≥70 ng/μL | OD260/280=1.75~2.0; OD260/230=1.5~2.6; NC/QC* =1.00~2.20 Fragments should be ≥30K |
*HMW = High Molecular Weight; NC/QC = NanoDrop concentration/Qubit concentration
ONT
| Service | Sample Type | Amount (Qubit®) | Volume | Concentration | Purity |
| Nanopore PromethION DNA library | HMW* genomic DNA | ≥8 μg | ≥50 μL | ≥100 ng/μL | OD260/280=1.75~2.0; OD260/230=1.4~2.6; NC/QC*=0.95~3.00 Fragments should be ≥30K |
*HMW = High Molecular Weight; NC/QC = NanoDrop concentration/Qubit concentration
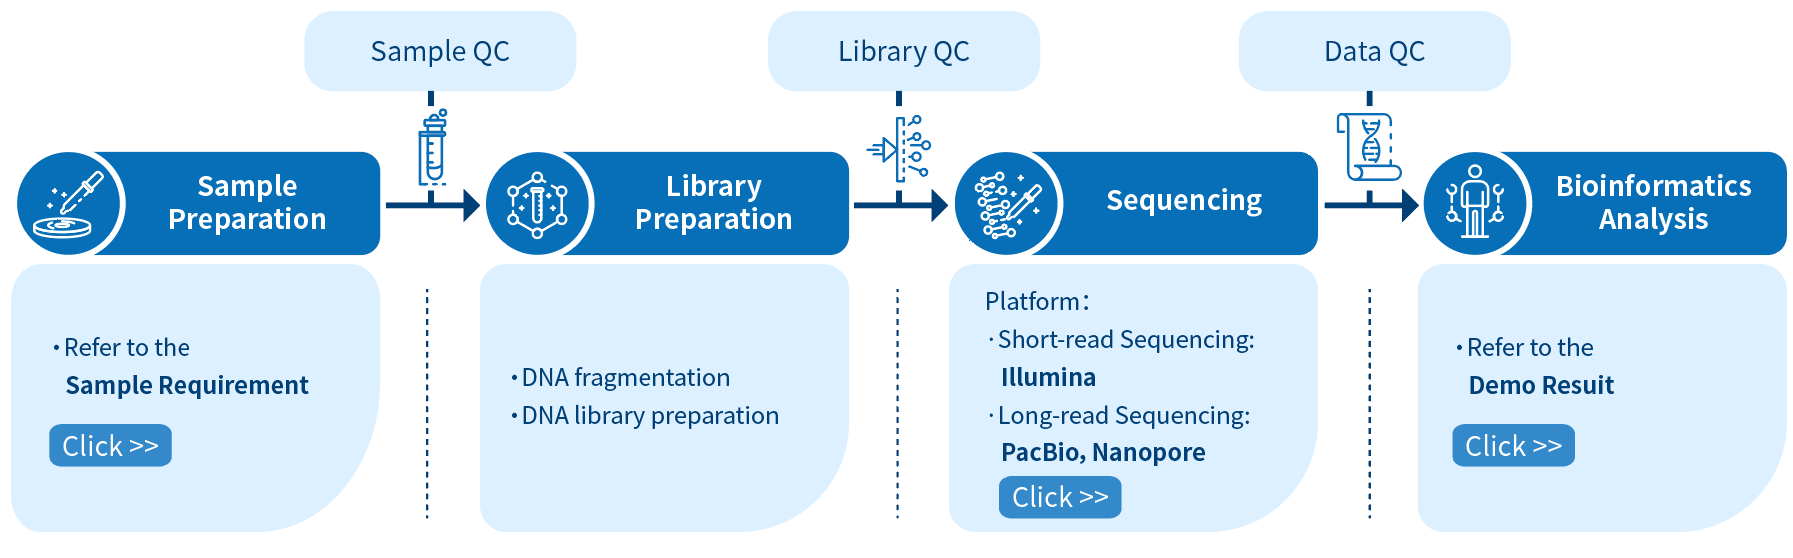
Project Workflow of Novogene hWGS Services
From sample preparation, library preparation, DNA sequencing and data quality control, to bioinformatics analysis, Novogene provides high-quality products and professional services. Each step is performed in agreement with a high scientific standard and meticulous design to ensure high-quality research results.
[1] https://www.genome.gov/about-genomics/fact-sheets/Sequencing-Human-Genome-cost
Publications of Human Whole Genome Sequencing
Human whole-genome sequencing (WGS) allows researchers to identify inherited disorders, characterize mutations that drive cancer progression, track disease outbreaks, and achieve many other research goals. Here we have summarized some outstanding academic publications that have been using novogene hWGS services.
-
Nano-DMS-MaP allows isoform-specific RNA structure determination
NATURE METHODSIssue Date: 27 April 2023IF: 47.99DOI: 10.1038/s41592-023-01862-7
-
Molecular CancerIssue Date: 29 May 2023IF: 41.444DOI: 10.1186/s12943-023-01792-0
-
The chemotherapeutic drug CX-5461 is a potent mutagen in cultured human cells
NATURE GENETICSIssue Date: 30 November 2023IF: 30.8DOI: 10.1038/s41588-023-01602-9
-
GASTROENTEROLOGYIssue Date: 24 March 2023IF: 29.4DOI: 10.1053/j.gastro.2023.03.208
-
Long-term Multimodal Recording Reveals Epigenetic Adaptation Routes in Dormant Breast Cancer Cells
Cancer DiscoveryIssue Date: 21 March 2024IF: 28.2DOI: 10.1158/2159-8290.CD-23-1161
-
BLOODIssue Date: 9 January 2024IF: 20.3DOI: 10.1182/blood.2023021906
-
Journal: JAMA CardiologyIssue Date: April 1, 2020IF: 12.794DOI: 10.1001/jamacardio.2020.0479
-
A genomic and epigenomic atlas of prostate cancer in Asian populations
Journal: NatureIssue date: March 25, 2020IF: 12.794DOI: 10.1038/s41586-020-2135-x
-
Journal: Journal of HepatologyIssue date: DECEMBER 01, 2019IF:20.582DOI: 10.1016/j.jhep.2019.07.014
-
Germline BMP9 mutation causes idiopathic pulmonary arterial hypertension
Journal: European Respiratory JournalIssue date: November 29,2019IF: 12.339DOI: 10.1183/13993003.01609-2018
-
Proteomics identifies new therapeutic targets of early-stage hepatocellular carcinoma
Journal: NatureIssue date: February 27,2019IF: 42.778DOI: 10.1038/s41586-019-0987-8
-
Mutational landscape of secondary glioblastoma guides MET-targeted trial in brain tumor
Journal: CellIssue date: October 18, 2018IF: 38.637DOI: 10.1016/j.cell.2018.09.038
-
Journal: Proceedings of the National Academy of SciencesIssue date: February 5, 2018; IF: 9.412DOI: 10.1073/pnas.1715554115
Data Quality Control
Sequencing Error Rate Distribution
The sequencing error rate is the major confounding factor of precise detection of low-frequency variations by deep sequencing. It determines the quality of the sequencing data. The sequencing error rate is highly associated with the sequencing cycle, escalating towards the end of each read because of the consumption of chemical reagents, which is a common feature of the Illumina high throughput sequencing platform.

Note: The x-axis represents position in reads, and the y-axis represents the average error rate of bases of all reads at a position.
GC Content Distribution
GC content distribution aims to check the potential of AT/GC separation. Sample contamination, sequencing bias, and errors during library preparation can impact on the sequencing results.

Note: The x-axis is position in reads, and the y-axis is percentage of each type of bases (A, T, G, C); different bases are distinguishable by different colors.
Alignment to Reference Genome
Sequencing Depth & Coverage Distribution
Sequencing depth and coverage illustrate the average number of pair-end clean reads which are aligned to the known reference nucleotides. The sequencing coverage distribution determines whether the identification of variations can be done with a certain degree of confidence at specific base positions.

Average sequencing depth (bar plot) and coverage (dot-line plot) in each chromosome.
Note: The x-axis represents chromosome;the left y-axis is the average depth; the right y-axis is the coverage (proportion of covered bases).
SNP/InDel/SV/CNV Calling
Single nucleotide polymorphisms (SNPs), also known as single nucleotide variants (SNVs), constitute the largest class of genetic variants in the genome. Another class of genetic variations includes small insertions and deletions (InDels) which are <50 bp in length. The InDels present in the coding region or splicing sites may cause changes in mRNA transcripts and proteins.

The number of SNPs/InDels in various genomic regions

The number of different types of SNPs/InDels in the coding region
Structural variants (SVs) are genetic variants with relatively larger sizes (>50 bp), and they include deletions, duplications, insertions, inversions, and translocations. SVs form the underlying genetic basis of individual differences and have potential effects on the disease and cancer susceptibility.

The number of different types of SV in each sample
Note: The x-axis represents samples, and the y-axis indicates the number of each type of SV.
Copy number variants (CNVs) are genetic variants that lead to variations in copy number of relatively larger fragments (longer than 50 bp) among individuals. There are two types of CNVs, i.e. gain and loss of copies. CNVs may form the underlying genetic basis of individual differences and cancers.

The size of genomic regions affected by CNVs in each sample
Note:The x-axis represents samples name, and the y-axis indicates the total size of genomic regions affected by gain or loss (Mb)
Advanced Analysis
Driver Gene Analysis
Heatmap of Significantly Mutated Genes
Only a few mutations related to cancer can drive tumorigenesis by affecting genes. Significantly mutated genes (SMGs) refer to those mutations that show a significantly higher mutation rate than the background mutation rate (BMR), thus indicating a positive selection during tumorigenesis. Analysis of SMGs helps us pinpoint the key genes that are critical for cancer initiation and progression.

Heatmap of significantly mutated genes (SMGs) across samples
Note:
The bar plot at the top shows the mutation rate of each sample (Mutations/Mb). The heatmap in the center shows the types of mutations of each SMG across samples. The horizontal axis represents samples, and the vertical axis represents SMGs. Different types of mutations are distinguished by different colors. The bar plot on the left side of the heatmap shows the percentage of samples affected by mutations in each SMG, and the plot on the right side shows p values of SMGs.
Tumor Heterogeneity Analysis
Intra-tumor Heterogeneity Analysis
Intra-tumor heterogeneity refers to the heterogeneous composition of tumor cells. Deciphering the intra-tumor heterogeneity and clonal architecture may contribute towards the understanding of therapeutic resistance.
The number and content (subclonal somatic mutations) of tumor subclones were identified by analyzing the variant allele frequencies of somatic mutations.

Inferred clonal architecture
Note:
The horizontal axis of each panel represents variant allele frequency (VAF). A cluster of mutations with relatively low VAF represents a subclonal population. The top panel shows kernel density of VAFs across regions with copy number one, two, or three, posterior predictive densities summed over all clusters for copy number neutral variants, and posterior densities for each cluster/component. The panels below the top panel show read depth versus VAFs for each class of copy number regions.
*Please contact us to get the full demo report.
